Figures & data
Figure 1. Representative trace of finger temperature (Tfinger) data throughout the experimental protocol along with time windows for cooling and rewarming analysis.
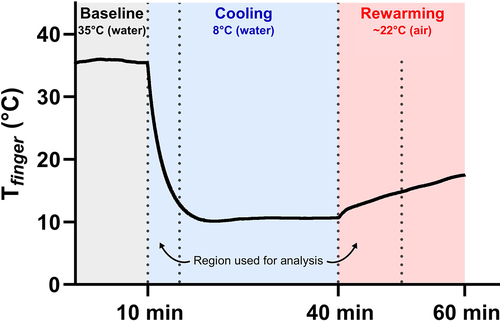
Table 1. Anthropometric characteristics of the digits of the fingers (n = 15).
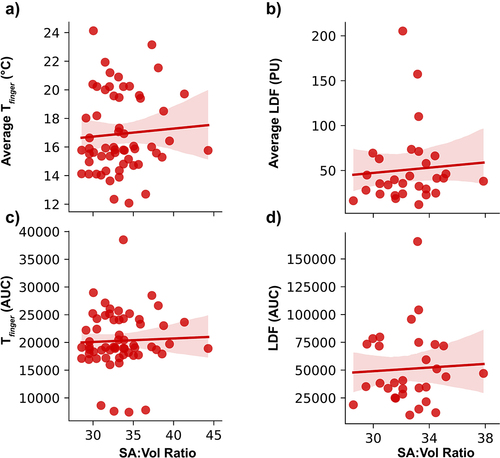
Figure 2. Thermal responses of the pooled digits during the first 5 minutes of cold water immersion. A) average finger temperature (Tfinger) (p = 0.05; R2 = 0.06); B) average laser-Doppler fluxmetry (LDF); C) area under the curve (AUC) for Tfinger (n = 59 for Tfinger) (p = 0.05; R2 = 0.07); D) AUC for LDF (n = 30 for LDF).
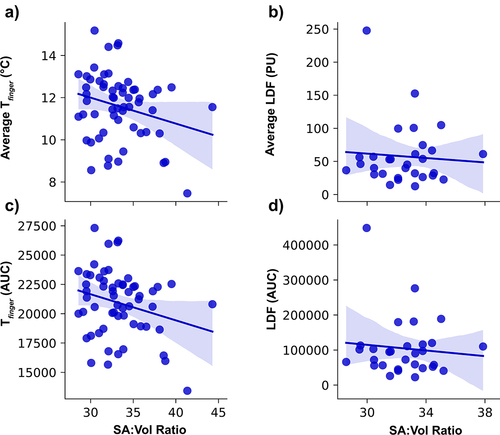
Figure 3. Thermal responses of the pooled digits during 10 minutes of rewarming. A) average finger temperature (Tfinger); B) average laser-Doppler fluxmetry (LDF); C) area under the curve (AUC) for Tfinger (n = 59 for Tfinger); D) AUC for LDF (n = 30 for LDF).