
Figures & data
Table 1. Summary of literature review on six sports.
Table 2. Settings for unknown parameters.
Table 3. Sport selection results.
Figure 1. Bland-Altman plot of measured and simulated core temperature in 29 experiments: 11 for general exercise experiments and 18 for six selected sports.
Abbreviations: CI, confidence interval; SD, standard deviation
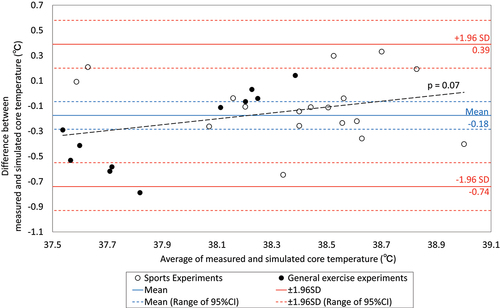
Figure 2. Predicted core temperature in six sports at the upper thresholds of the thermal safety guidelines (99.7th percentile).
Abbreviations: prep, preparation; RH: relative humidity; Ta: ambient temperature; WU: warm-up
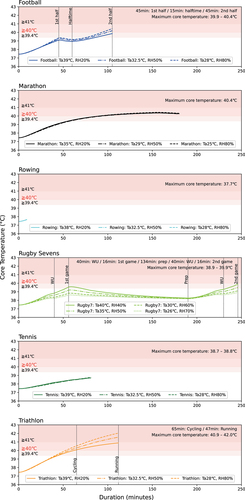
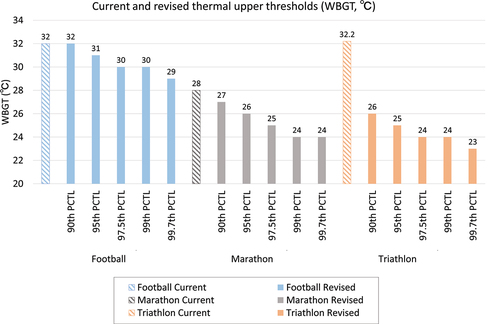
Figure 3. Current and revised upper thermal thresholds for football, marathons, and triathlons.
Abbreviations: PCTL, percentile; WBGT, Wet Bulb Globe Temperature
Supplemental material
Supplemental Material
Download MS Word (9.8 MB)Data availability statement
The datasets generated and analyzed during the current study are available from the corresponding author upon reasonable request.