
Figures & data
Table 1. Participant characteristics pre- and post-summer, including O2peak and reported Tanner stage.
Table 2. Gastro-intestinal and skin temperature, heart rate, hemoglobin mass, and plasma and blood volume at rest pre- and post-summer.
Figure 1. Gastro-intestinal temperature during 45 min of walking at 60% O2peak in 40°C and 30% relative humidity pre- and post-summer. The thick lines represent the population predicted means surrounded by 90% credible intervals. Model estimates are based on the arithmetic mean of
O2peak. The model was implemented using data from 5-min intervals. Observed data are visualized at 15-min intervals.
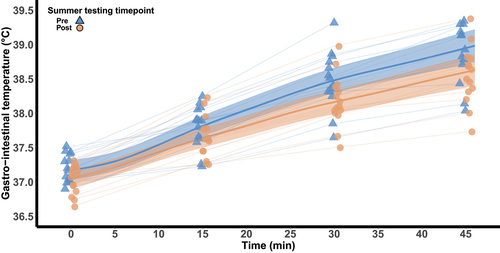
Figure 2. Heart rate during 45 min of walking at 60% O2peak in 40°C and 30% relative humidity pre- and post-summer. The thick lines represent the population predicted means surrounded by 90% credible intervals. Model estimates are based on the arithmetic mean of
O2peak. The model was implemented using data from 5-min intervals. Observed data are visualized at 15-min intervals.
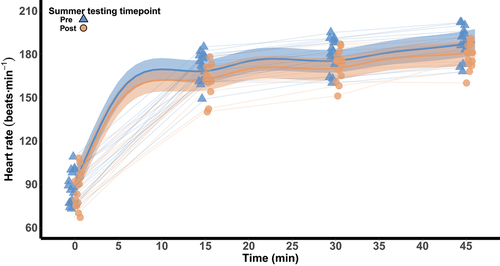
Table 3. Gastro-intestinal temperature, heart rate, whole-body sweat loss, and sweat sodium concentration during the heat response test pre- and post-summer.
Figure 3. Mean maximum dry-bulb and wet-bulb globe temperature from October 1st 2022 to March 31st 2023. The individual data points represent weekly averages. The vertical dashed black lines represent the start and end of summer, respectively.
Data availability statement
The data and associated code used for analyses are available from the corresponding author upon reasonable request.