Figures & data
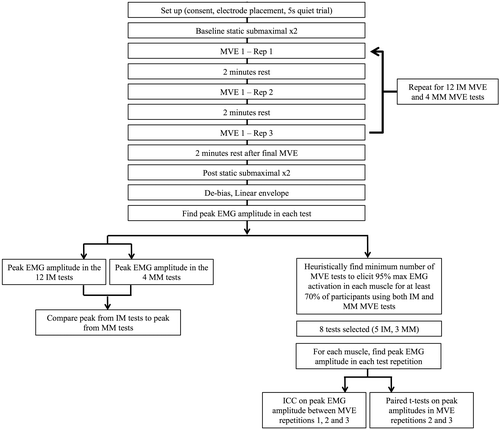
Figure 1. Overview of study protocol and analyses. IM = individual muscle test, MM = multi-muscle test.

Table 1. Test postures and exertions for the individual muscle (IM) and the multi-muscle (MM) test protocols (Ekstrom et al. Citation2005; Dark et al. Citation2007; Boettcher et al. Citation2008; Waite et al. Citation2010; Hodder & Keir Citation2013). Test postures were confirmed with a manual goniometer.
Table 2. Maximum EMG voltage for each muscle from the 12 individual muscle tests (IM) and the 4 multi-muscle tests (MM). Muscles with significantly different mean values are denoted with *. The muscles % difference values that are less than 100% had greater max values with the individual muscle (IM) tests and those that are greater than 100% had greater values from the multi-muscle (MM) tests.
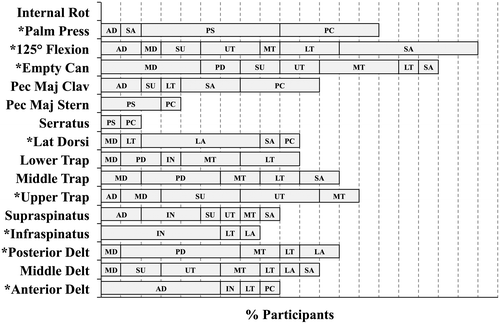
Figure 2. Percent of participants that achieved at least 95% of the listed muscles maximum amplitude with each test. Each vertical dashed line represents 10% of the participants. Tests marked with * are the ones selected for the recommended test protocol for future work. For example, using the palm press test, anterior deltoid was activated to greater than or equal to 95% of maximum in 10% of participants, serratus anterior in 10%, pectoralis major sternal 70% and pectoralis major clavicular in 60% of participants.

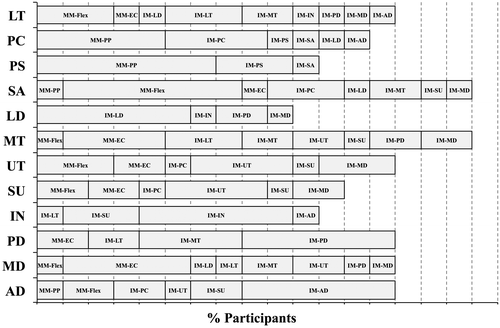
Figure 3. The percent of participants that had at least 95% of the listed muscles maximum amplitude with the listed tests. Each vertical dashed line represents 10% of the participants. For example, the latissimus dorsi was activated to greater than or equal to 95% of maximum activation for 60% of participants in the IM-LD test, 10% in the IM-IN test, 20% in the IM-PD test and 10% of participants in the IN-MD test.

Table 3. ICC values (mean measures) and 95% confidence intervals showing the reliability between the three repetitions of each muscle’s maximum amplitude in the set of eight tests.
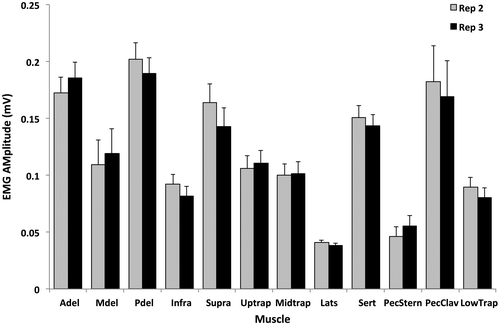
Figure 4. Comparison of maximum sEMG amplitude between the second and third repetitions of the recommended eight test protocol for each muscle. Reliability of maximum sEMG amplitude (V) between the second and third repetitions. There were no statistically significant differences in the maximum values elicited between the second (grey bars) and third (black bars) repetitions of the protocol (p > 0.05). Error bars depict the within subject standard deviations between the two repetitions.

