1,012
Views
7
CrossRef citations to date
0
Altmetric
Articles

Normative kinematics of reaching and dexterity tasks: moving towards a quantitative baseline for Functional Capacity Evaluations (FCEs)

ORCID Icon &
Pages 37-49 | Received 13 Oct 2016, Accepted 12 Apr 2017, Published online: 15 Dec 2017

Figures & data

Table 1. Order of task and subtask performance.

Table 2. Anatomical landmark locations of individual markers.

Figure 1. HFD placing task setup.
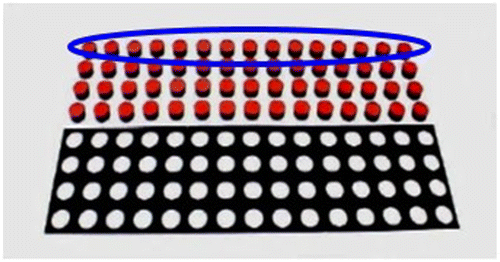
Note: For this subtask, only the cycles involving movement of the blocks in the row circled were used for analysis.
Figure 1. HFD placing task setup.

Table 3. Mean capacity scores for males and females during each FCE subtask.

Figure 2. Kinematic profiles with mean (bold line) +/− one standard deviation (gray shaded area) during the right to left, right hand and left to right, right-hand RR subtasks: torso + left/− right axial rotation (top), right humeral abduction (second), right humeral flexion (third), and right elbow flexion (bottom).
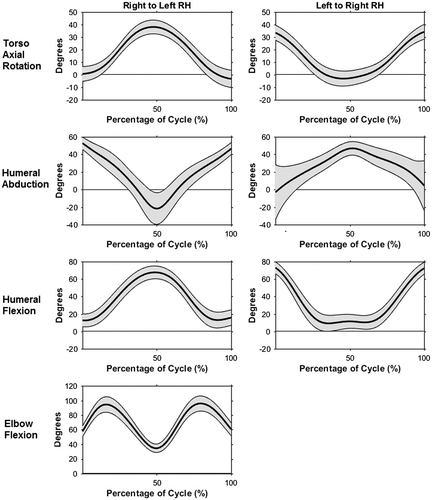
Notes: In the same direction/hand sub tasks, humeral abduction peaks during marble pick up and humeral flexion peaks during marble drop off but during the opposite direction/hand the pattern is reverse. The pattern of motion for the elbow was the same for all subtasks.
Figure 2. Kinematic profiles with mean (bold line) +/− one standard deviation (gray shaded area) during the right to left, right hand and left to right, right-hand RR subtasks: torso + left/− right axial rotation (top), right humeral abduction (second), right humeral flexion (third), and right elbow flexion (bottom).

Figure 3. Kinematic profiles with mean (bold line) +/− one standard deviation (gray shaded area) during the right hand, both hands, and assembly FD subtasks: torso + left/−right axial rotation (top), right humeral flexion (second), right humeral + internal/− external axial rotation (third), and right elbow flexion (bottom).
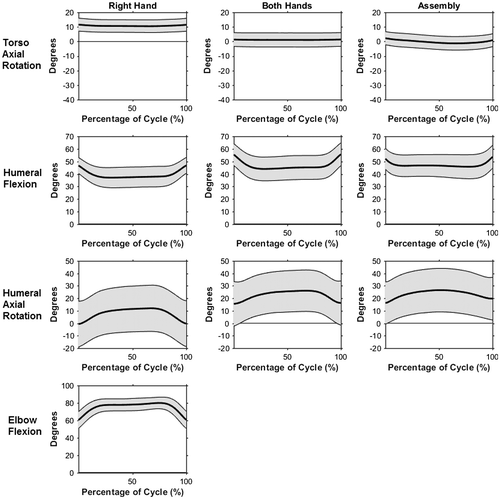
Notes: Flexion decreases slightly during pin placement, while internal rotation increases during pin placement for all subtasks. The pattern of motion for the elbow was the same for all subtasks.
Figure 3. Kinematic profiles with mean (bold line) +/− one standard deviation (gray shaded area) during the right hand, both hands, and assembly FD subtasks: torso + left/−right axial rotation (top), right humeral flexion (second), right humeral + internal/− external axial rotation (third), and right elbow flexion (bottom).

Figure 4. Mean humeral flexion angle and mean humeral axial rotation angle of the right arm with +/− one standard deviation during the HFD placing task.
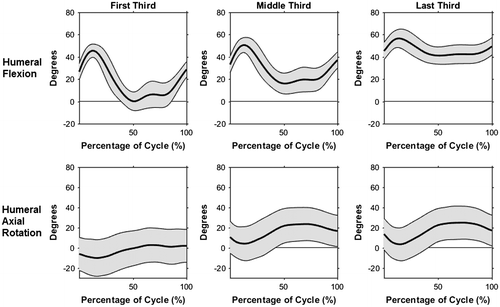
Note: Both mean flexion and mean internal rotation increase from the first third to the last third.
Figure 4. Mean humeral flexion angle and mean humeral axial rotation angle of the right arm with +/− one standard deviation during the HFD placing task.

Figure 5. Kinematic profiles with mean (bold line) +/− one standard deviation (gray shaded area) during hand and forearm turning subtask: torso + left/− right axial rotation (top), right humeral abduction (second), right humeral flexion (third), right humeral + internal/− external axial rotation (bottom).
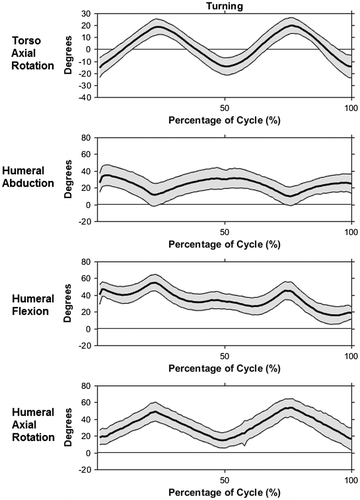
Note: Peaks in torso and humeral axial rotation occur when the hands are at the edges of the board.
Figure 5. Kinematic profiles with mean (bold line) +/− one standard deviation (gray shaded area) during hand and forearm turning subtask: torso + left/− right axial rotation (top), right humeral abduction (second), right humeral flexion (third), right humeral + internal/− external axial rotation (bottom).

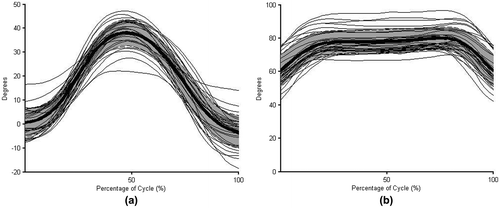
Figure 6. Individual raw mean angle curves overlaying the normative profiles of torso axial rotation in the RR task (a) and elbow flexion during the FD (b) tasks with the mean of the profiles in bold and +/− one standard deviation shaded in gray.

Figure 6. Individual raw mean angle curves overlaying the normative profiles of torso axial rotation in the RR task (a) and elbow flexion during the FD (b) tasks with the mean of the profiles in bold and +/− one standard deviation shaded in gray.

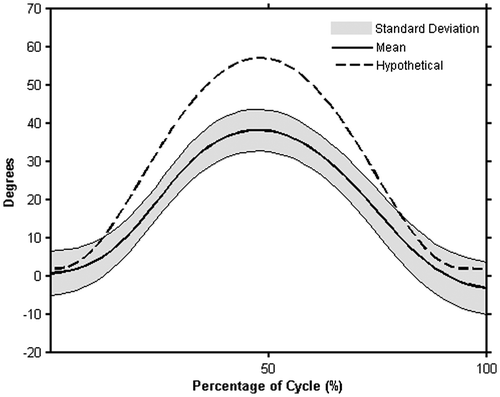
Figure 7. Hypothetical comparison of pathological torso axial rotation (dotted line) to the normative axial rotation profile generated in the current study during the RR task with the mean of the profiles in bold and +/− one standard deviation shaded in gray.

Figure 7. Hypothetical comparison of pathological torso axial rotation (dotted line) to the normative axial rotation profile generated in the current study during the RR task with the mean of the profiles in bold and +/− one standard deviation shaded in gray.