
Figures & data
Table 1. Patient demographics
Figure 1. Structure for patient-specific models using (A) MRI-based morphing and (B) linear scaling techniques. *Graphic is adapted from supplementary figure B in Halonen et al. (Citation2017). **Graphic is adapted from Figure 2 in Lund et al. (Citation2015) substituting bone geometries for TLEM 2.0 STLs
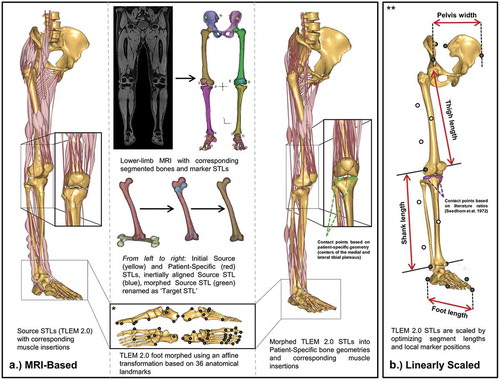
Figure 2. Gait modification techniques (baseline-shod, toe-in, toe-out, and wide stance walking) and lateral-wedged insoles (0°, 5°, and 10°)
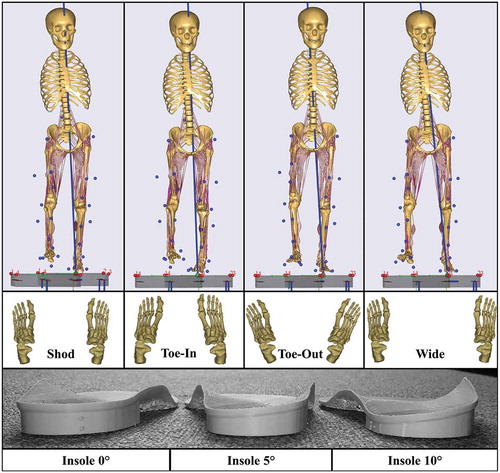
Table 2. Comparison of MRI-based and Linearly scaled models: Patient-group mean ± standard deviation peak medial MCF, MCF impulses, peak KAM, and KAM impulse (n = 5 patients, m = 3 trials for each gait) data of each gait alteration
Table 3. Comparison of MRI-based and Linearly scaled (LS) models: Individual patient peak KAMs, KAM impulses, peak MCF, and MCF impulses (mean ± standard deviation from n = 3 trials) of each gait alteration
Table 4. Comparison of MRI-based and Linearly scaled models for gait alteration that results in the greatest average reduction in load (MCF peak and impulse, separately) looking at the individual patients and as a group of patients
Figure 3. Comparison of MRI-based (solid lines) and Linearly scaled (dashed-lines) models in terms of mean knee adduction moment (KAM), medial compressive forces (MCF), and lateral compressive forces (LCF) for each individual patient (n = 3 trials) during stance phase of various gait alterations: shod (black), 0° insole (green), 5° insole (red), 10° insole (blue), Toe-in (orange), Toe-out (magenta), and width (cyan). In addition, subject means are displayed in the bottom row (n = 5 subjects, 3 trials each)
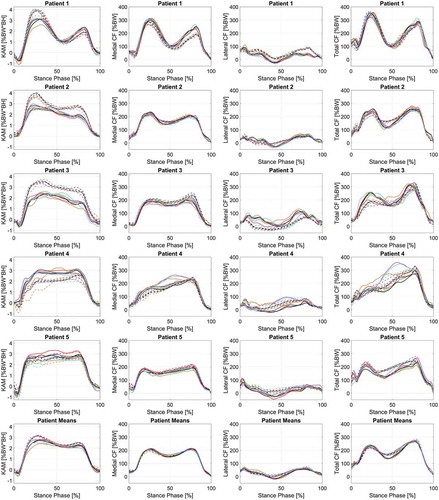
Table 5. Pairwise comparison results from post-hoc testing of two-way repeated-measures ANOVA investigating the mean difference of peak medial contact force between baseline (shod) and selected treatment outcome based for the Linearly scaled and MRI-based models (%BW)
Table 6. Pairwise comparison results from post-hoc testing of two-way repeated-measures ANOVA investigating the mean difference of medial contact force impulse between baseline (shod) and selected treatment outcome based for the Linearly scaled and MRI-based models (%BW*s)