Figures & data
Table 1. Range of motion for thoracohumeral and scapulothoracic rotations during SKIN and PIN sessions
Table 2. The maximum value of SHRand its corresponding thoracohumeral elevation during SKIN and PIN sessions
Figure 1. Thoracohumeral and scapulothoracic kinematics during arm elevation/depression in frontal plane (abduction) and sagittal plane (flexion) for each subject. Dotted line shows the SKIN session and filled line shows the PIN session. Thick lines show the mean value and the shaded areas show standard deviation. SKIN/PIN: session before/after bone-pin insertion
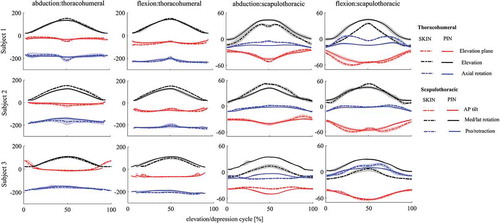
Figure 2. SHR during arm elevation/depression in frontal (left) and sagittal (right) plane. Blue shows elevation, red depression, dotted lines SKIN session and filled lines PIN session. Thick lines show the mean value and the shaded areas show standard deviation. SKIN/PIN: session before/after bone-pin insertion
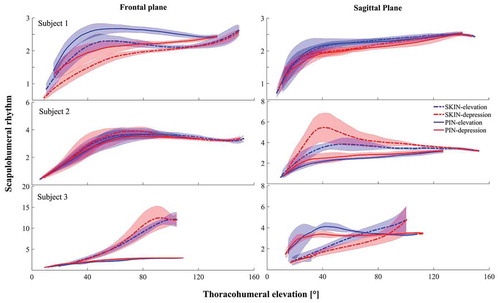
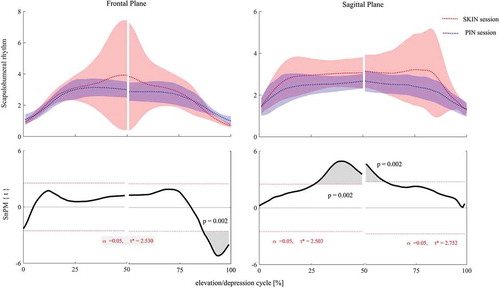
Figure 3. Non-parametric paired t-test analysis for comparing SHRduring arm elevation/depression in frontal (left) and sagittal (right) plane. Red shows SKIN session and blue shows PIN session. Thick lines show the mean value and the shaded areas show standard deviation. SKIN/PIN: session before/after bone-pin insertion