Figures & data
Table 1. Description of powers and cadences performed by participants in Groups 1 and 2. This table shows the three conditions for relative power and cadence (self-selected moderate, +10% and -10% of self-selected)
Figure 1. Representative force data from the first 500 revolutions of a single bicycling bout were extracted for one participant. Each of the 500 revolutions was time-normalized (0–100), and the mean (solid line) and 95% confidence interval (dashed line) of the time-normalized pedal reactions forces for the PRFN (A) and PRFAP (B) are plotted
Table 2. Mean and standard deviation of measured cumulative reaction forces (total impulse) for the PRFN, PRFAP, and PRFR groups, and both groups combined. There were no statistically significant differences in measured cumulative load between the groups, for any of the three reaction forces (p > 0.35)
Figure 2. R2 (A), slope (B), and normalized RMSE (C) for the following estimates of cumulative load: ePRFN (solid red), ePRFAP (dotted blue), and ePRFR (dashed green) produced using each individual percent of the collected data
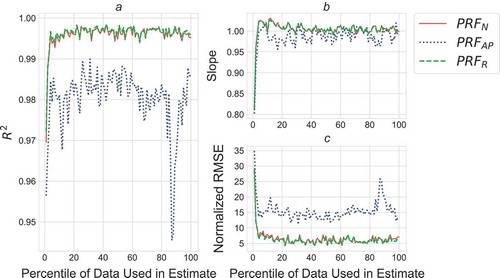
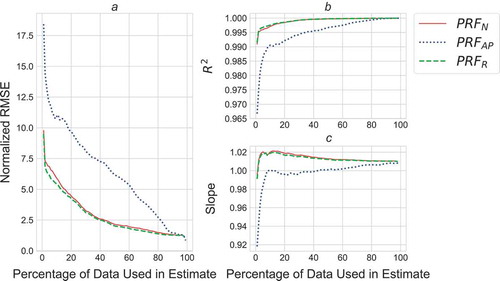
Figure 3. Normalized RMSE (A), R2 (B), and slope (C) for estimates of cumulative load produced using between 1% and 99% of the whole activity for PRFAP (dashed blue), and between 1% and 98% of the whole activity for PRFN (solid red) and PRFR (dashed green)