Figures & data
Figure 1. Schematic of the experimental setup with enlarged view of the microfluidic device placed on the stage of an inverted microscope. After cell seeding to the bottom surface of the upstream reservoir near the channel, cells migrated into the 5 × 5 µm channel as illustrated. Using a three-way valve, we delivered the prescribed negative pressure to the front-end of the migrating cell through a gauge needle inserted through the wall of the downstream reservoir. The time course of the displacements at the front-end of the cell was measured from recorded video images. Note that, we sealed the pressure at the downstream reservoir right before we activated the negative pressure application using a cover slip
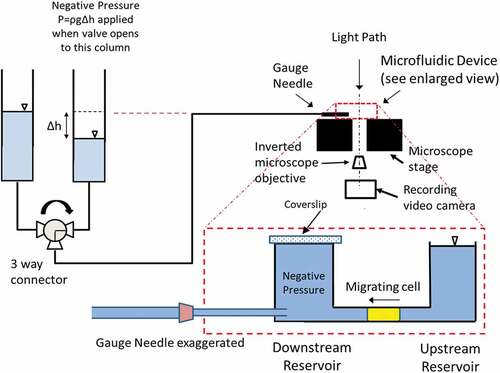
Figure 2. Images showing the front-end displacement of a GBM cell in A) stationary and C) actively migrating state under applied negative pressure of – 20 cm H2O at the direction of white arrow head. Yellow arrows highlight the front-end of the cell where measurements were taken. B) and D) are the respective illustrations to highlight the cell in microchannel and their front-end displacement at the loaded state. E) Prescribed negative pressure was activated, maintained at constant level for 30 s before its release to baseline value. F) Representative front-end displacements from the cell in stationary and migrating state through the time course of negative pressure application
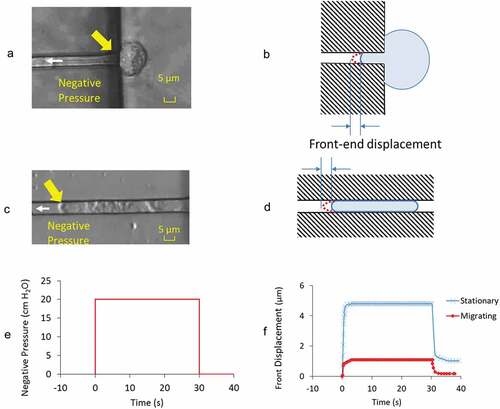
Figure 3. A) A Voigt model representation that consists of an elastic spring (spring constant E) and a dashpot (damping coefficient η) connected in parallel. B) Measurements of recorded front-end displacements was divided into two phases: aspiration from 0 to 30 s and retraction from 30 to 40 s. Each phase was curve-fitted to a Voigt model representation as shown
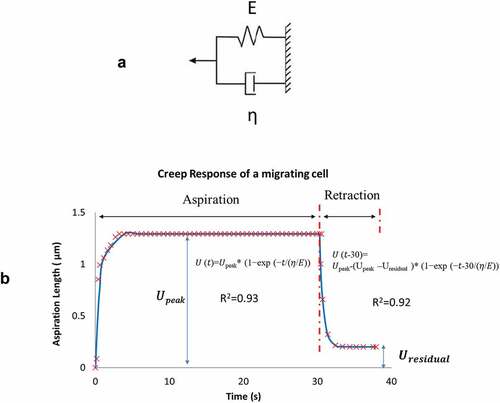
Figure 4. A) Aspiration lengths of cells (Upeak) in migrating group were found to be much lower than that in stationary groups for all negative pressure load from −20 to −40 cm H2O. B) η/E ratios of cells in migrating group were found to be less than 1 and much lower than that in stationary groups for all pressure load from −20 to −40 cm H2O. C) A table summarizing sample sizes from stationary and migrating groups at different pressure levels
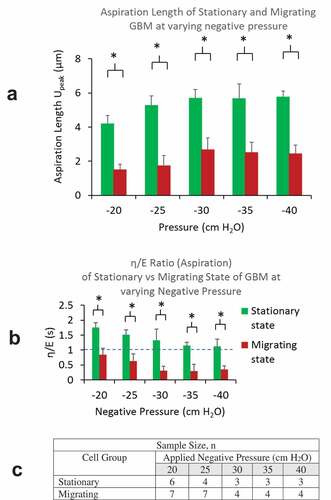
Figure 5. A) Residual lengths of cells (Uresidual) in migrating group were found to be much lower than that in stationary groups for all negative pressure load from −20 to −40 cm H2O. B) η/E ratios of cells in migrating group were found to be less than 1 and all much lower than that in stationary groups for all pressure load from −20 to −40 cm H2O. C) A table summarizing sample sizes from stationary and migrating group at different pressure levels
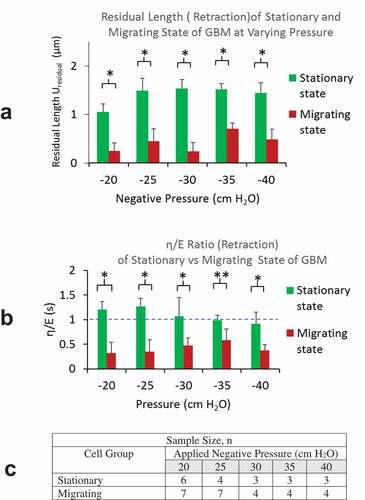
Figure 6. A) Simultaneous recording of the front and posterior-end displacements of a GBM cell in actively migrating state show near-zero displacement at the posterior-end, indicating the recorded front-end displacement are due to the cell deformation in response to the negative pressure load (at – 20 cmH2O), excluding any likely sliding movement of the cell in the channel. B) Cells from stationary group showed both front and posterior-end displacement. The corresponding intracellular fluid movement from the rear to the front compartments of the cell is discussed in the text
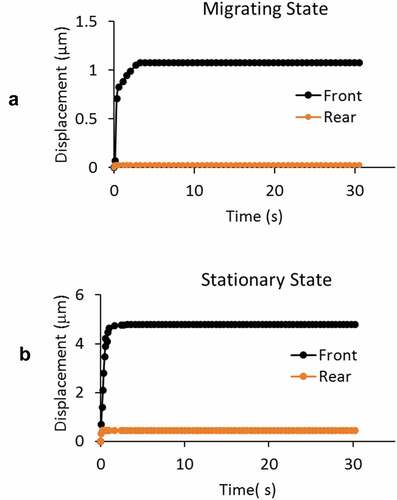
Figure 7. A) Immuno-cytochemical examination showed a significantly higher level of polarized actin and myosin-II filaments at both the front and posterior ends of cells in migrating group. Intracellular distributions from stationary group showed low level of expression without any regional preference. B) Polarized distributions in actin and myosin were found from GBM cells in migrating group. The fluorescent intensity along the axial length of the migrating cells was normalized with that of the entire cell. On the horizontal axis, 0 denotes the front end and 1 denotes the posterior end of the cells. C) From GBM cells in stationary group, distributions of normalized fluorescent intensities in both actin and myosin oscillate around 1
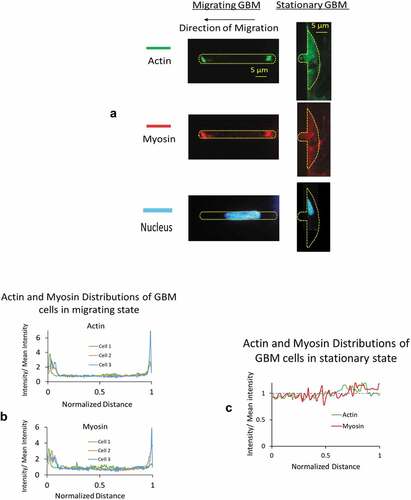
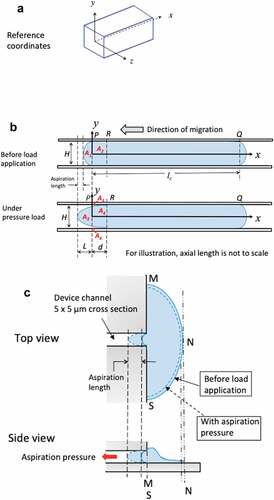
Figure 8. A) 3D reference coordinates for the channel. Channel has a cross section of 5 × 5 μm and an axial length of 530 μm. For illustration, the axial length of the channel is not to the scale. B) Simplified 2D plots on xy plane to illustrate the time-varying boundary conditions for the migrating cells before and when under aspiration pressure load. C) Top view and side view of GBMs from stationary group. Cells adhered to 2D reservoir substrate were in a stalling state with unsuccessful attempt to migrate into the microchannel of 5 × 5 μm in cross section