Figures & data
Figure 1. Experimental setup for isometric knee extensor strength testing
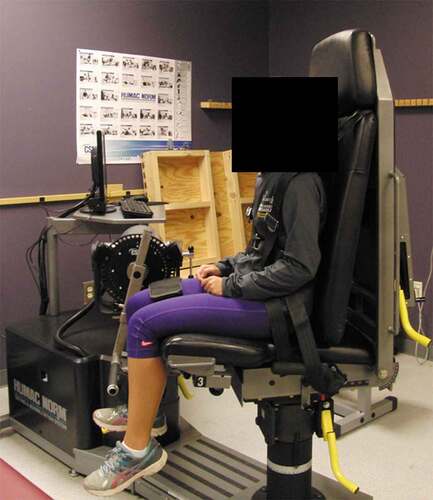
Table 1. Average values for peak isometric torque, mean isometric torque and standard deviation showing variability of peak isometric torque between trials on each of the three test days. All values are shown as the mean of that variable ± SD. * p <.05 comparing day 1 to day 3. All other day-to-day comparisons were non-significant
Figure 2. (a) Comparison of the difference in isometric mean values from day 1 to day 2 (b) Comparison of the difference in isometric mean values from day 1 to day 3. Each data point represents the difference in mean isometric torque production values for each individual participant. The red line represents the overall mean difference between the two days. The dotted lines represent the upper and lower limits of agreement
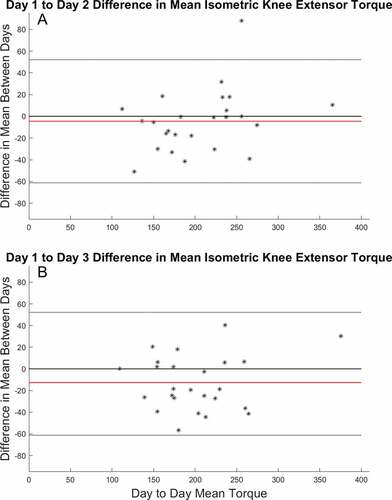
Table 2. Average values for peak isokinetic torque, mean isokinetic torque and standard deviation showing the variability of peak isokinetic torque between trials on each of the three test days. All values are shown as the mean of that variable ± SD. * p <.05 comparing day 1 to day 2 and day 1 to day 3. All other day-to-day comparisons were non-significant
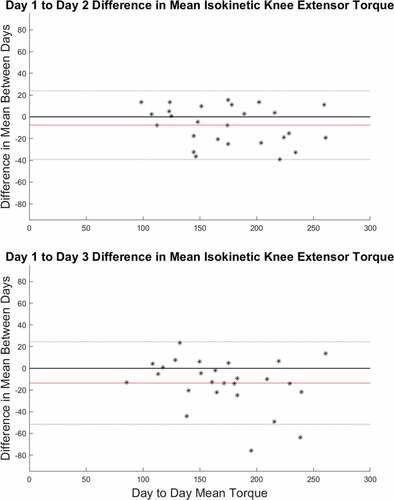
Figure 3. (a) Comparison of the difference in isokinetic mean values from day 1 to day 2 (b) Comparison of the difference in mean isokinetic values from day 1 to day 3. Each data point represents the difference in mean isokinetic torque production values for each individual participant. The red line represents the overall mean difference between the two days. The dotted lines represent the upper and lower limits of agreement