Figures & data
Figure 1. Types of footwear studied, in addition to barefoot, with average plantarflexion angle difference with the barefoot condition. An asterisk signals a significant difference (p < 0.05). Only when wearing heels did the subjects exhibit a significant increase in plantarflexion compared to barefoot
Figure 2. Examples of pressure maps for each footwear condition for a single subject
Figure 3. a) Motion analysis markerset (blue) and pelvis coordinate system (X axis in red, Y in green, and Z in blue). b) Trunk and leg angle definitions
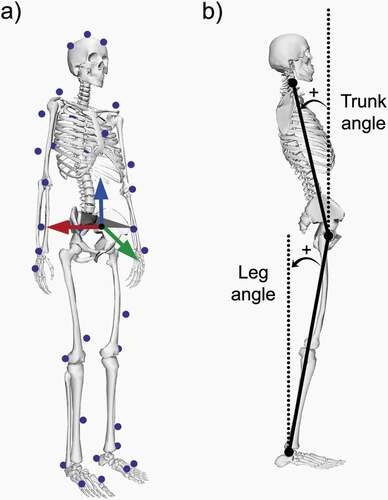
Figure 4. a) Example of instantaneous pressure map during quiet standing barefoot (pixel = 8.5 × 8.5 mm) with COP under the left foot (green triangle), under the right foot (red triangle), and global (blue circle). b) Example of COP displacement during quiet standing barefoot. The COP of interest is the global one (blue)
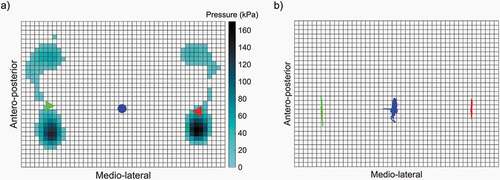
Figure 5. Total sway over 60 s for the four footwear conditions. For each boxplot, the central line represents the median value, the bottom and top of the box represent the 25th and 75th percentiles, and the whiskers are linked to the most extreme data points not considered outliers. An asterisk signals a significant difference (p < 0.05) when compared to the barefoot condition. The global postural sway was significantly reduced when wearing heels (p = 0.01)
Figure 6. Average COP velocities over 60 s for the four footwear conditions. An asterisk signals a significant difference (p < 0.05) when compared to the barefoot condition. The global average velocity was significantly reduced when wearing heels (p = 0.011)
Figure 7. α values computed using detrended fluctuation analysis for the four footwear conditions. A value of 0.5 indicates a random signal, whereas higher values indicates a more complex signal corresponding to a more adaptable system. Although there was a decrease of the global and AP α values when wearing heels, it was not significant
Figure 8. Range of motion ratios between the trunk and leg angles over 60 s for the four footwear conditions. Although there was an increase in the use of the hip joint relative to the ankle joint between each footwear condition and the barefoot condition, it was not significant
Figure 9. Percentage of total power contained in three frequency bands: below 0.5 Hz (visuovestibular control), between 0.5 and 2.0 Hz (cerebellar control), and above 2.0 Hz (proprioceptive control). The power developed by the proprioceptive system was significantly higher in the ML direction than in the AP direction for all the footwear conditions (p < 0.01)