
Figures & data
Figure 1. Thickness of the crown a) thin b) typical thickness crown.
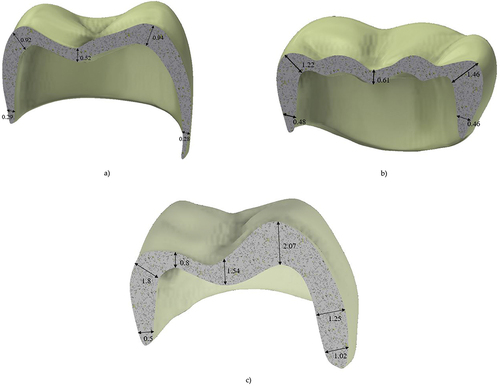
Figure 2. 3D model of the restored first molar, (a) indenter, (b) crown, (c) dentin, (d) root.
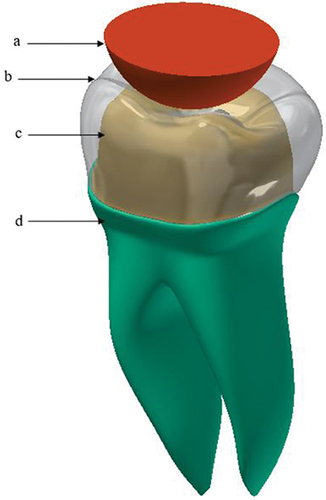
Figure 3. Boundary conditions and applied loading (arrow) for the used model.
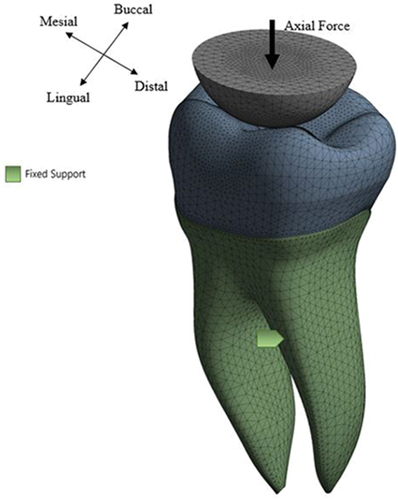
Figure 4. Fatigue strength S-N curve for restorative material used (Homaei et al. Citation2016).
Table 1. Material properties for the restored first molar model.
Figure 5. Sensitivity mesh analysis for the number of elements.
Figure 6. Max tensile stress for the three groups studied under axial compressive load =150 N for zirconia crown, a) group a, b) group b, c) group c.
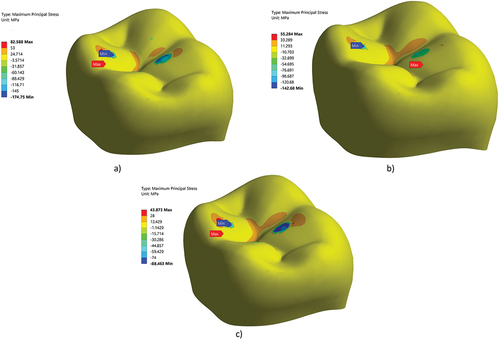
Figure 7. Survival rates the three groups tested under two loading conditions, a) axial loading, b) axial followed by 0.8 mm sliding.
Table 2. Shear stress at the dentin-adhesive interface [MPa].