
Figures & data
Figure 1. Illustration of electroactive capacitive sensor (surface mechanomyography) application across the bulk of a muscle and lengthens as the muscle contracts (depicted in red).
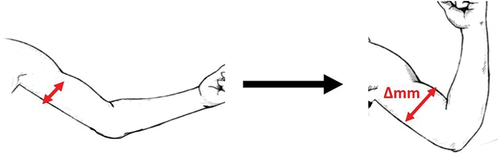
Figure 2. EMG and sMMG sensor applications for the quadriceps (a), hamstrings (b), and gastrocnemius (c).
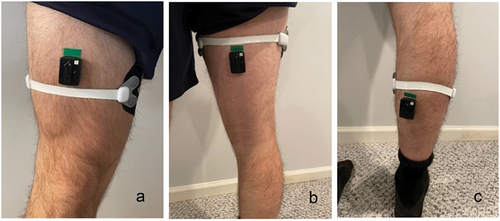
Figure 3. Testing positions for the isometric contraction testing. Handheld dynamometry positioning is shown for the quadriceps (a), hamstrings (b) and the gastrocnemius (c).
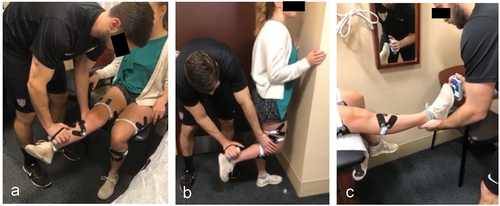
Figure 4. Illustration of the parallel squat activity.
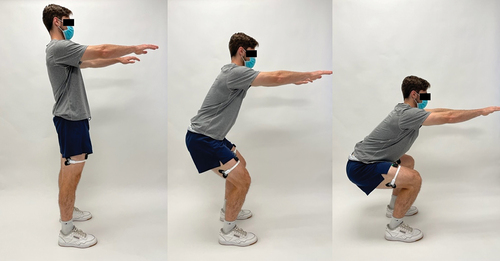
Figure 5. Raw quadriceps contraction data output from a parallel squat sEMG (top), filtered sEMG (middle) used for data analysis comparison to raw sMMG (bottom).
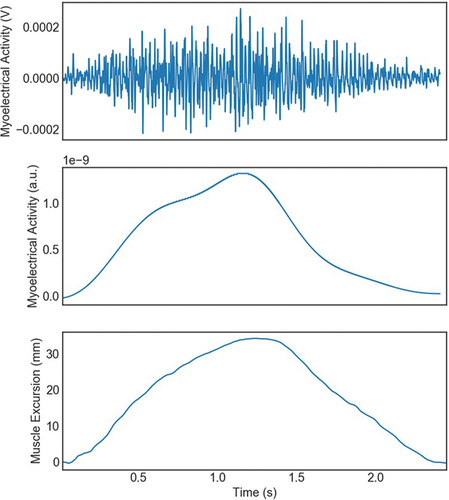
Figure 6. Correlation plots of sMMG contraction duration compared to force HHD (dotted line) and EMG (solid line) for quadriceps (a), hamstrings (b) and gastrocnemius (c).
Table 1. Results of Pearson R correlation coefficient analyses of the average muscle activation duration (all trials n = 161) for the quadriceps, hamstrings and gastrocnemius muscles, across the three measurement methods for 15 persons.
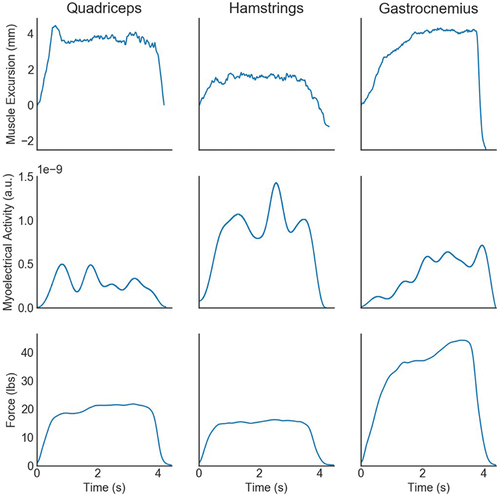
Figure 7. Sample data for illustration comparing contraction output across the three methods of capturing contraction duration: sMMG (top row), filtered EMG (middle row), and force output (bottom row) for the quadriceps (left), hamstrings (middle), and gastrocnemius (right).
Data availability statement
Due to the nature of this research, participants of this study did not agree for their data to be shared publicly, so supporting data is not available.