
Figures & data
Table 1. Notable ICS cyberattacks (2000 – 2023).
Figure 1. Dependency modelling graph.
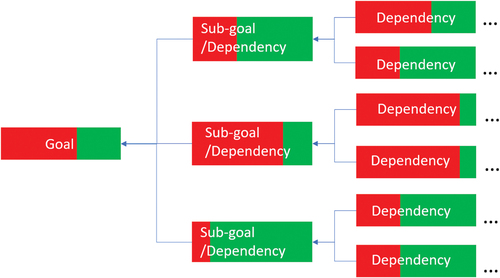
Figure 2. RiskED process flow.
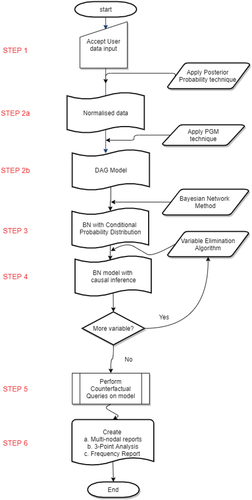
Algorithm 1. RiskED Process Flow
Figure 3. High-level depiction of the dependency model.
Figure 4. Communication network segmentation showing zones and conduits.
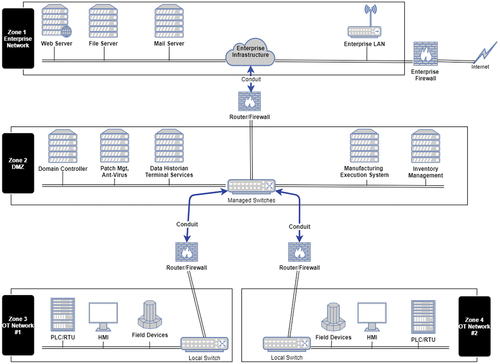
Table 2. Risk assessment data based on IEC 62,443 method.
Table 3. Case study: dependency model.
Table 4. Causal inference with single node.
Table 5. Causal inference with two nodes.
Table 6. Causal inference with three nodes.
Figure 5. Single node 3-point sensitivity using causal inference.
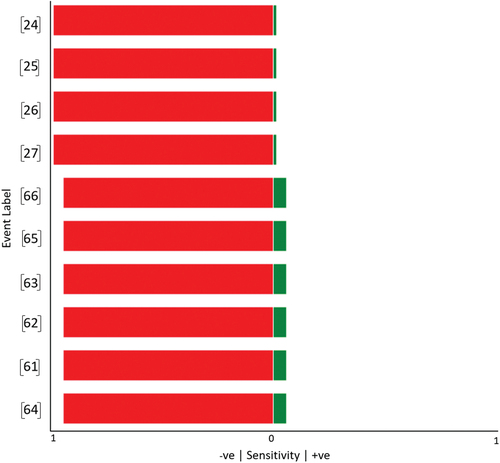
Figure 6. Two-nodal 3-point sensitivity analysis using causal inference.
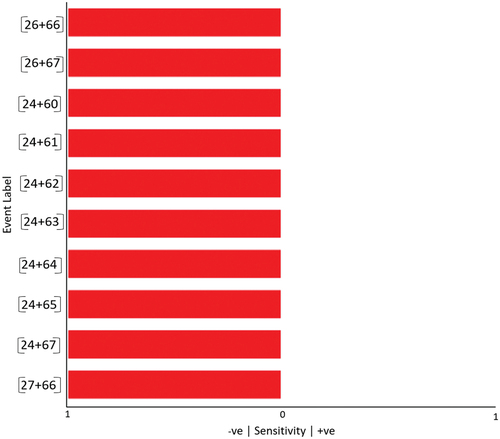
Figure 7. Three-nodal 3-point sensitivity analysis using causal inference.
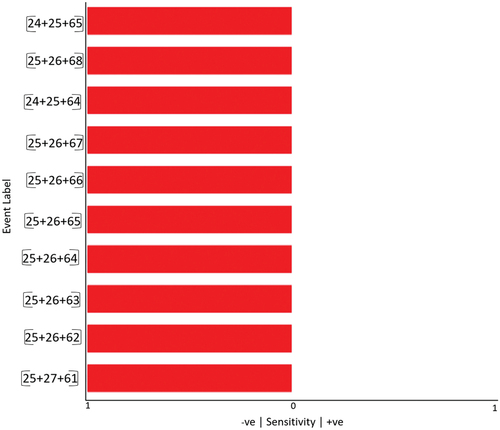
Figure 8. Two-nodal frequency analysis - negative impact.
Figure 9. Three-nodal frequency analysis - negative impact.
Data availability statement
All data is provided in full in the results section of this paper. No new data was created during this study.