
Figures & data
Table 1. Treatment allocation, dose/day in the three different treatment groups.
Figure 1. Increase in skin thickness (dermis and epidermis; (a) and density (b) during supplementation. Skin density and thickness were measured by means of ultrasound (B-scan).
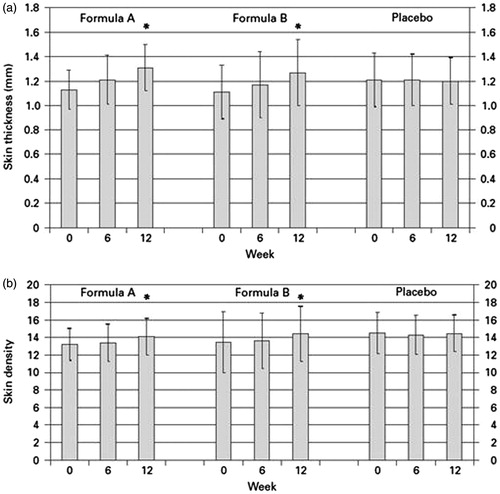
Figure 2. Skin density before (a) and after 12 weeks of treatment with formula A (b). A typical ultrasound B-scan shows the density and thickness of the dermis before and after 12 weeks of treatment; obtained from a volunteer of group 1.
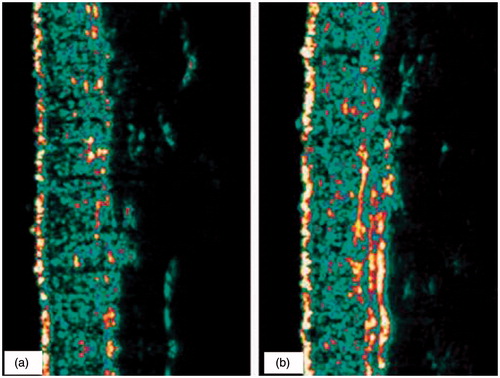
Table 2. Results and statistical evaluation of the ultrasound measurements, skin density and skin thickness.
Figure 3. Skin surface evaluation. Surface of the skin of a volunteer from group 2 (formula B) before (a) and after 12 weeks of treatment (b); CCD picture and 3-D computerized image. Skin surface was evaluated by image analysis (SELS).
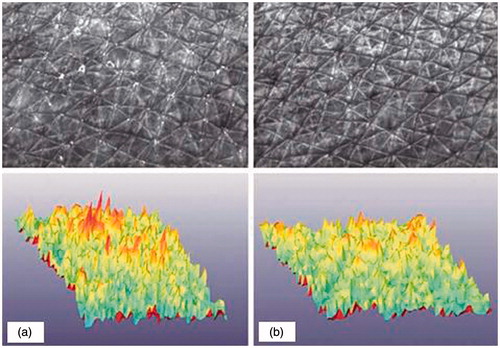
Figure 4. Decrease in roughness (a) and scaling (b) during supplementation. Skin surface was evaluated by image analysis (SELS).
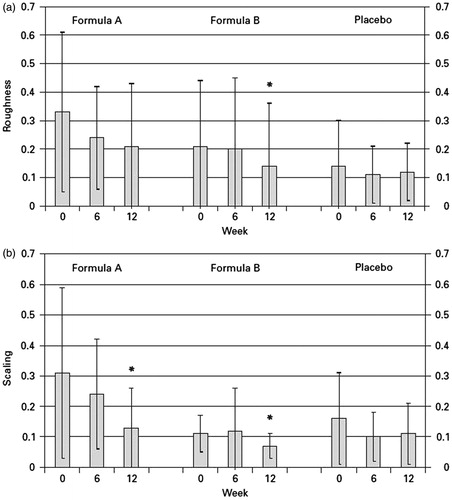
Table 3. Results and statistical evaluation of the skin surface evaluation.
Table 4. Antioxidants in serum (nmol) determined by HPLC analysis and statistical evaluation.