
Figures & data
Figure 1. Typical strain profile in a creep–recovery test and calculation of different compliance contributions from the strain profile using the designated values defined in the figure: (a) elastic compliance (EC) = ɛc(0)/σo, (b) total compliance at time t = ɛc(t)/σo, (c) viscoelastic compliance (VECC)=total recovered compliance at time t − recovered elastic compliance = {ɛu−ɛr(t) − (ɛu−ɛr(0)}/σo= {ɛr(0) −ɛr(t)}/σo and (d) viscoplastic compliance (VPCC)= total compliance at time t in creep curve − total recovered compliance at time t in recovery curve= {ɛc(t) − (ɛu−ɛr(t)}/σo.
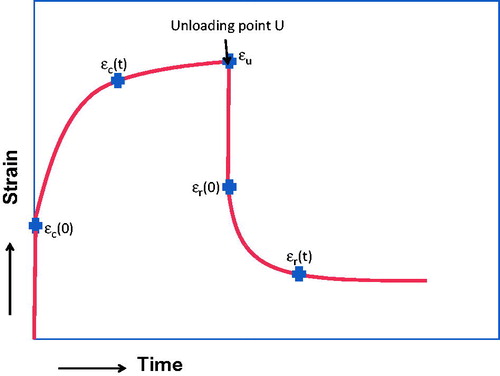
Table 1. Materials.
Figure 2. Illustration of the dual cantilever clamp with a sample placed in the clamp for flexural deformation. The sample is fixed at the ends by the right and left clamps, and deformed in flexure by the movable middle clamp.
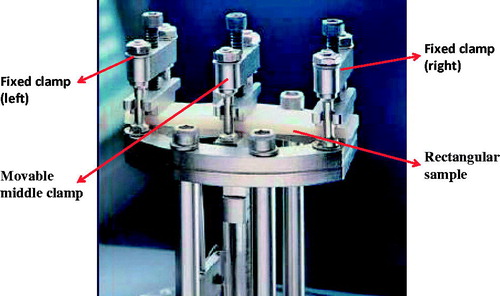
Figure 3. Typical examples of creep–recovery curves in (a) JET, (b) PRO, (c) LXT and (d) TRM. Note the maximum (10%) strain in TRS as compared with <1% in JET, PRO and LXT. Note also differences in scales used to accommodate the large strain values in TRM.
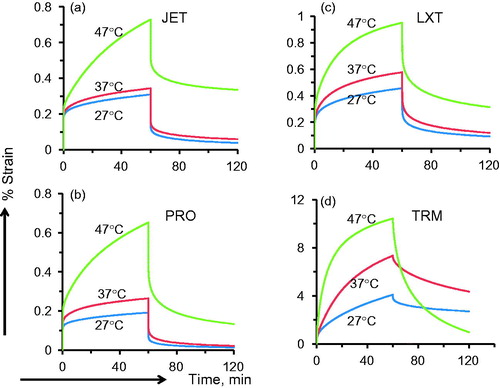
Figure 4. Post-test appearance of specimens. Note the visually detectable macroscopic deformation in TRM, but not in other materials.
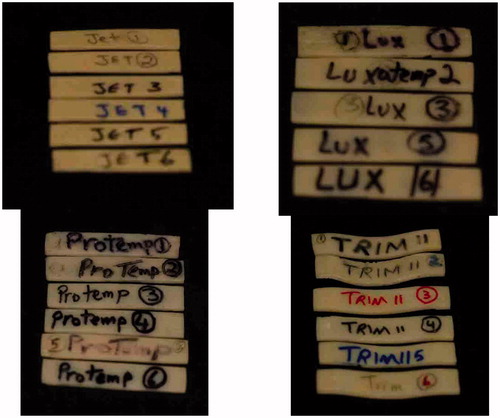
Figure 5. Example of total compliance (TC) variation as a function of time. Note the large difference in TC between TR and other formulations.
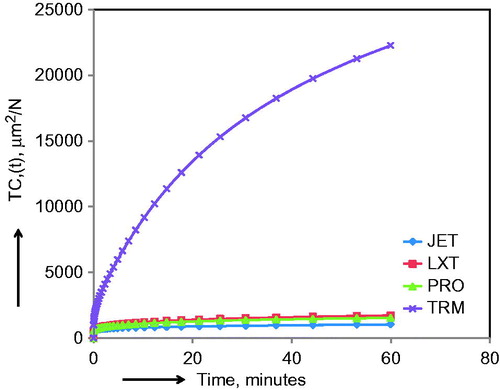
Figure 6. Example of viscoelastic creep compliance as a function time {VECC(t)}. Note the large difference in VECC values between TR and other formulations.
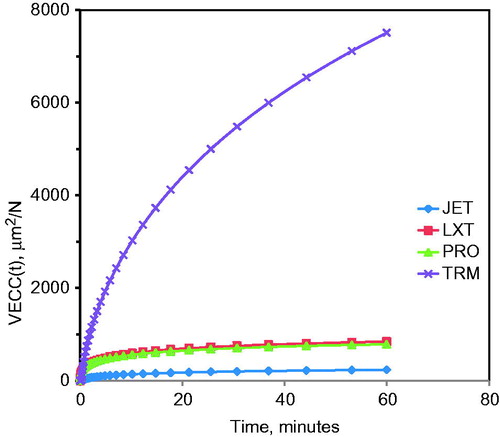
Figure 7. Example of viscoplastic creep compliance as a function of time {VPCC(t)}. Note the large difference in VPCC values between TR and other formulations.
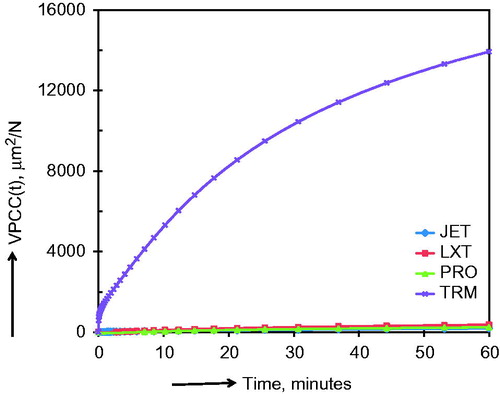
Figure 8. Bar graphs showing means and (SDs) illustrating differences between compliance contributions as a function of materials and temperature. (a) TC, (b) EC, (c) VECC60 min and (d) VPCC60 min. Note that for better clarity, the compliance scale used for different bar graphs are not identical due to large differences in the compliance values. Note also the large difference in all compliance parameters between TR and other formulations.
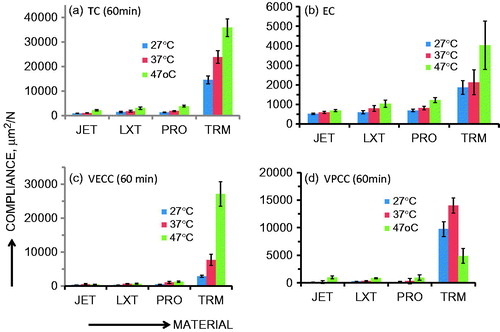
Table 2. Consolidated summary of ANOVA results for TC, EC, RCC60 min and NRCC60 min significant differences.
Table 3. Statistical analysis: Tukey contrasts.(a) Tukey contrast of compliance LS means: materials effectsTable Footnotea.
(b) Tukey contrast of compliance LS means:temperature effects Table Footnotea.
(c) Tukey contrast of compliance LS means: interactive effectsTable Footnotea.