Figures & data
Table 1. Particle size distributions of experimental cements and their constituents.
Figure 1. Effect of curing conditions on the physical properties on MTA. Bars show means and errors bars indicate 95% confidence intervals. Differences between groups were calculated with the Kruskal–Wallis test, with post-hoc Dunn’s multiple comparison tests. Error bars are 95% confidence intervals. Bars indicated with the same letters are significantly different. S: Storage conditions for 1 week. T: Testing conditions.
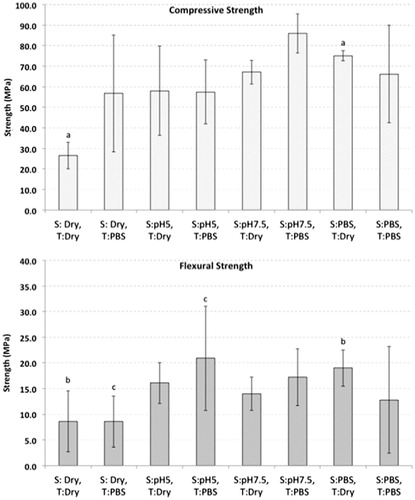
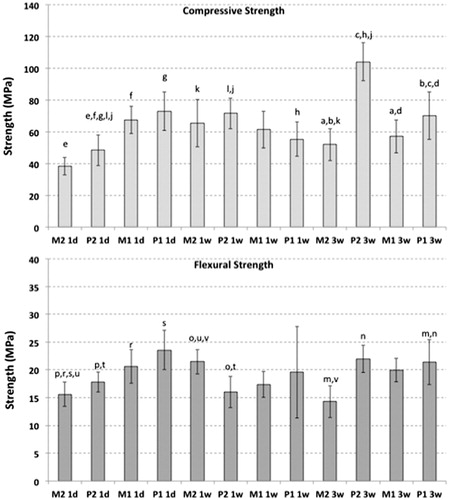
Figure 2. Influence of particle size and time on the physical properties of MTA, when stored in PBS. Bars show means and errors bars indicate 95% confidence intervals. Differences between groups were calculated with parametric ANOVA with post-hoc Bonferroni’s multiple comparison tests. Bars indicated with the same letters are significantly different. 1d, 1w, 3w: Stored in PBS for 1 day, 1 week and 3 weeks, respectively.