Figures & data
Table 1. Materials used in this study.
Figure 1. Mean values of water sorption and solubility of the tested materials in μg/mm3. Whiskers represent the standard deviation. There were statistically significant differences among all groups for both sorption and solubility (p < .05).
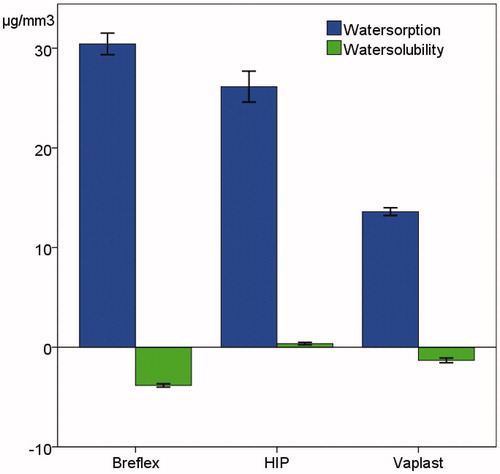
Figure 2. The mean difference in weight over time of specimen discs measured in g. The specimens were inserted in water after reaching a constant mass at m1 and removed from water at m2 (constant mass wet specimens). The reconditioned mass was determined as m3.
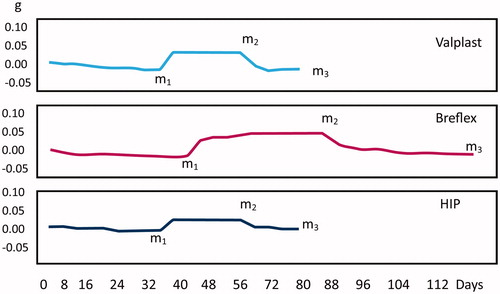
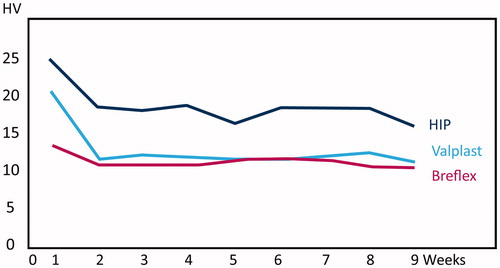
Figure 3. The mean Vickers hardness over time in water immersion, expressed as HV0.5.