Figures & data
Figure 1. Implant- and surface characteristics. Images illustrating implant characteristics and SEM micrographs of the morphology of the implant surface. †Sa value 0.9 μm and Sdr value 34% [Citation71]. ††Sa value 1.1 μm and Sdr value 37% [Citation71]. SEM micrographs (original magnification, †10 kX and ††5 kX).
![Figure 1. Implant- and surface characteristics. Images illustrating implant characteristics and SEM micrographs of the morphology of the implant surface. †Sa value 0.9 μm and Sdr value 34% [Citation71]. ††Sa value 1.1 μm and Sdr value 37% [Citation71]. SEM micrographs (original magnification, †10 kX and ††5 kX).](/cms/asset/fa00f78f-bd7f-4abe-9296-d261113ea5b4/iabo_a_1399270_f0001_c.jpg)
Figure 2. Illustrations and radiographs from the insertion procedure in the pig jaw model system. (a) Exposed bone after a mucoperiosteal flap was performed. Two implant sites are prepared and an implant is inserted in the first site. (b) X-ray showing an implant and one prepared implant site (drill control) in the bone. (c) Vertical cuts of the bone with a micro bone saw to separate the implant, the drill control without implant and the bone control without implant or preparation for implantation.
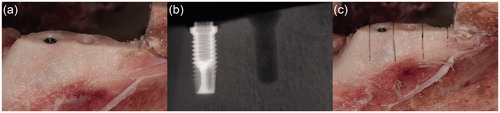
Table 1. Operating conditions of the ICP-AES for the determination of Ti in bone samples.
Table 2. Microwave digestion program for bone.
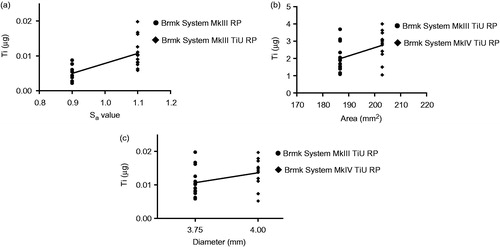
Figure 3. Titanium (Ti) release during insertion of the tested implants. Mean Ti-content (µg) ±SD (n = 61) found in the bone samples with ICP-AES analysis are shown in the bar chart. Kruskal-Wallis H test with a Dunn’s test for multiple comparisons against bone control and between the tested implants with a significance level of p < .05. **p = .01 and ***p < .001.
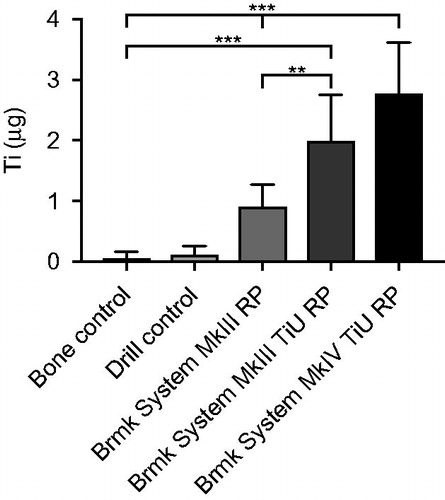
Figure 4. SEM micrographs illustrating the morphology of Brmk System MkIII machined surface. (a) Overview of the top of an Brmk System MkIII machined implant (original magnification 30 X). (b–d) The surface structure differs on sides of the threads, there deeper grooves in the implant surface after the turning instrument can be seen, compared to the edges and between the threads a smoother surface can be seen. Higher magnification of the rougher part on the sides of the threads showing the irregularities of the surface structure, with grooves and some protruding metal fragments (original magnification is (b) 200 X, (c) 10 kX and (d) 50 kX). (e) Overview of the top of an Brmk System MkIII machined implant after insertion into the bone (original magnification 30 X). (f–h) Biological material can be seen on the surface of the implant. No obvious damages to the surface can be seen in higher magnifications after insertion into the bone. Biological material is clearly visible on the surface (original magnification is (f) 200 X, (g) 10 kX and (h) 50 kX).
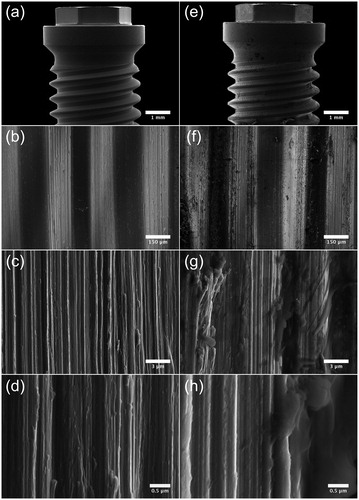
Figure 5. SEM micrographs illustrating the morphology of Brmk System MkIII TiUnite surface. (a) Overview of the top of an Brmk System MkIII TiUnite implant (original magnification 30 X). (b–d) Anodized surface with elevations, depressions and pits, which is rougher than the machined surface and gives the implant a surface enlargement (original magnification is (b) 5, (c) 10 and (d) 30 kX, respectively). (e) Overview of the top Brmk System MkIII TiUnite implant after insertion into the bone (original magnification 30 X). (f–h) In higher magnification, it is clearly visible that the TiUnite surface is covered with biological material after insertion. Bone are visible in the elevations, depressions and pits, but no obvious damages to the surface can be seen. (original magnification is (f) 5, (g)10 and (h) 30 kX, respectively).
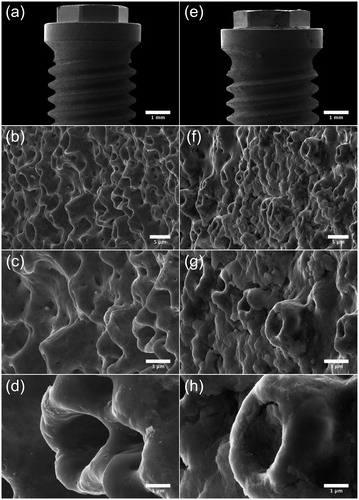
Figure 6. Effect of surface roughness, total implant-bone area and implant diameter on titanium (Ti) released into the bone during insertion. (a) Amount of Ti released (µg) from a machined surface compared with a TiUnite surface with the same 3.75 mm diameter and compensations for the bone-implant area made, but different surface roughness Sa = 0.9 vs. 1.1. Statistical analysis with linear regression show a correlation between surface roughness and Ti release, r2 = 0.457, p < .001 (n = 29). (b) Amount of Ti released (µg) from implants with same surface roughness, but different bone-implant area. Linear regression shows a weak correlation between bone-implant area and Ti release, r2 = 0.200, p = .020 (n = 27). (c) Amount of Ti released (µg) from implants with the same surface roughness and compensations for the bone-implant area made, but with different implant diameters, 3.75 vs. 4.0 mm. Linear regression show a no correlation between implant diameter and Ti release, r2 = 0.121, p =.076 (n = 27).