Figures & data
Figure 1. Heat map of cytokine levels in culture supernatants of human peripheral blood mononuclear cells (PBMCs) (n = 8) that were exposed to 0 μM (Cells), 500 μM (T500) or 1000 μM (T1000) of triethylene glycol dimethacrylate (TEGDMA). The cytokine levels in the culture supernatants were measured with a multiplexed bead-based cytokine immunoassay. The median value combined from the eight different individuals were calculated for each cytokine and the values were normalized and transformed using Hierarchical Clustering Explorer into color codes representing higher (black), intermediate (grey), and lower (white) expression of each cytokine.
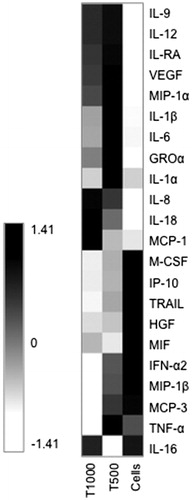
Figure 2. Cytokine production by PBMCs exposed to two different concentrations of TEGDMA. The concentrations of the proinflammatory cytokines (a) IL-1β, (b) IL-6, (c) IL-8, (d) TNF-α, (e) IL-18 and (f) GRO-α in the supernatants from cultures of PBMCs (n = 8) cultured with or without TEGDMA for 24 h. Statistical analysis was carried out using Wilcoxon matched-pairs signed-rank test; *p < .05; **p < .01; ***p < .005.
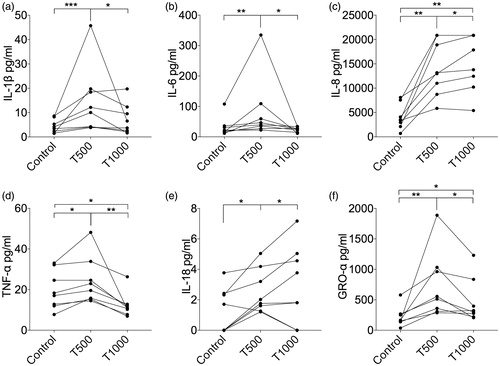
Figure 3. MCP-1 levels in culture supernatants after TEGDMA treatment of human PBMCs (n = 8) for 24 h. Statistical evaluation was performed using the Wilcoxon matched-pairs signed-rank test; *p < .05; **p < .01.
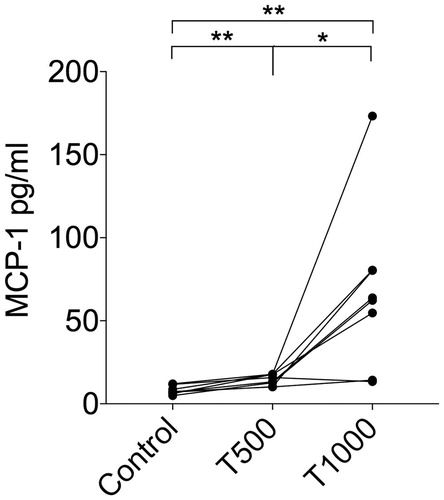
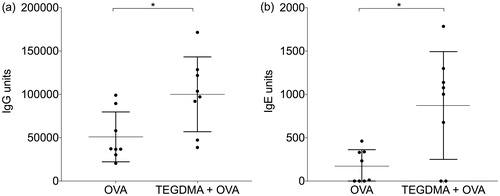
Figure 4. IgG and IgE anti-ovalbumin (OVA) antibody levels in mice. Mice (n = 8/group) were immunized with OVA with or without TEGDMA. The mice received an identical booster injection 3 weeks after the first immunization and were sacrificed 2 weeks after the booster injection. The IgG (a) and IgE (b) anti-OVA antibody levels in sera were determined by ELISA. The Mann–Whitney U test was used for statistical comparison; *p < .05.