Figures & data
Figure 1. Flow-chart showing teeth preparation. Bovine incisors were first sectioned to standard a certain crown/root ratio (a). Canals were thereafter prepared to simulate immature teeth (b). These teeth were divided to groups (1–4) according to the filling material used (1: MTA, 2: Biodentine, 3: TotalFill, 4: Gutta-percha). Some sectioned teeth, remained unprepared and served as controls (group 5).
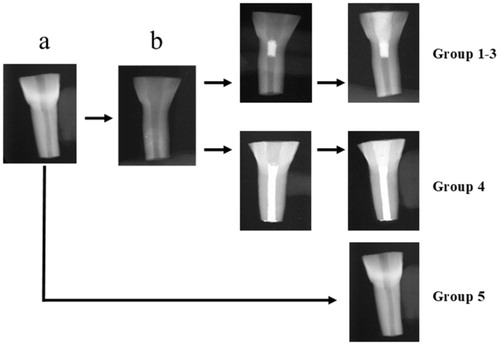
Table 1. Summary of the Tricalcium Silicate Cements (TSC) cements used in the study.
Figure 2. The simulated immature teeth (groups 1–4, n = 41) had a statistically significant larger canal diameter (2,153 ± 0,07 mm) and lower dentin thickness measured at the CEJ (1,857 ± 0,027 mm) compared to the intact teeth (1,780 ± 0,13 mm and 2,704 ± 0,098 mm, respectively) (group 5, n = 10); Results are presented as mean ± SEM, Mann-Whitney test, *p < 0.05; ***p < 0.001.
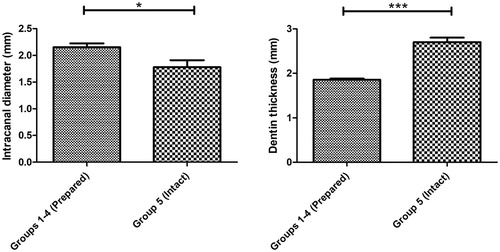
Table 2. Dimensions (mean ± SEM) of the bovine teeth used in the study.
Figure 3. Typical fracture pattern of the immature teeth under the fracture test. (a) and (b): Biodentine group; (c) and (d): Gutta-percha group; (e) and (f): Intact teeth group. The diagonal fracture line extends from the buccal aspect through the canal to the lingual aspect of the tooth. The treated immature teeth fractured at the interface between the material plug/or gutta-percha and composite filling (a-d). The fracture line of the intact teeth is mainly located within the crown (e-f). Lingual aspects: (a), (c) and (e); Lateral aspects: (b), (d) and (f). (×1 Magnification).
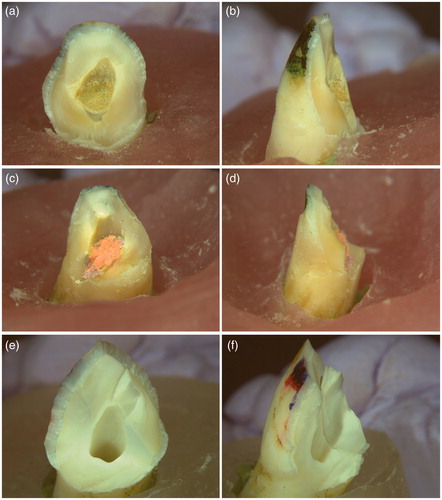
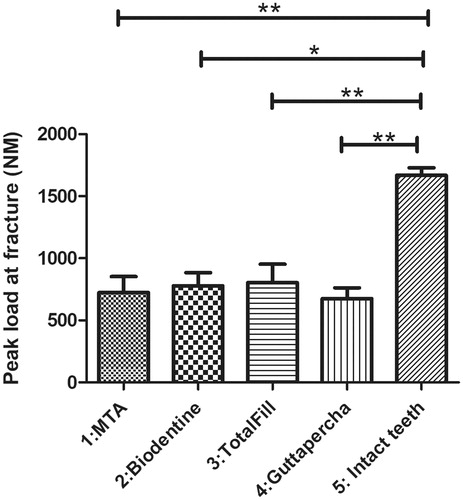
Figure 4. Intact teeth showed a significantly higher peak load to fracture in comparison to the other four groups (1669 ± 60.77 N). Simulated immature teeth filled with gutta-percha showed the lowest peak load to fracture (GP: 675.8 ± 86.84 N). Simulated immature teeth filled with TotalFill showed a higher peak load to fracture (804.5 ± 147.8 N) compared to the other TSCs (MTA: 724.2 ± 128.2 N and Biodentine: 779.4 ± 104.7 N). However, there was no statistically significant difference between the simulated immature teeth regardless of the material. Results are presented as mean ± SEM, Kruskal-Wallis test with Dunn’s multiple comparison, *p < 0.05; **p < 0.01.