Figures & data
Figure 1. (A) Principal Component Analysis (PCA) map of the area between Hisar and Kalibangan, highlighting the palaeochannels. (B) Three major palaeochannels under discussion in the paper, as mapped from PCA at A. These are the northern (marked in green), the central (reddish brown), and the southern (red) palaeochannels. (Mehdi et al., Citation2016)
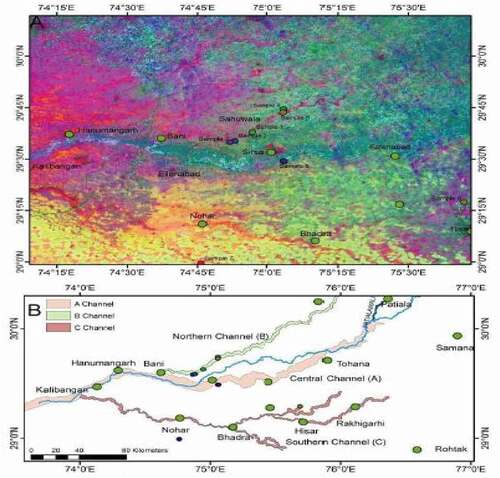
Figure 2. First section of the GPR transect trace file of the park access road traveling northeast. The first visible feature is characterized by the horizontal linear channel-fill stratification. (Hambly, Citation2015)
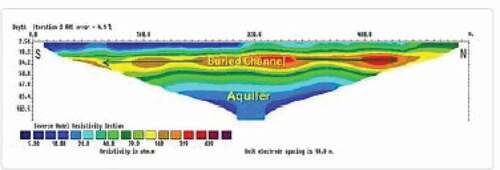
Figure 3. Shows the 2D inverted resistivity second along Kasaur Site (KA −2) delineating the buried channel anomaly with variable thickness and its lateral extension along with the aquifer zone. (Kumar et al., Citation2012)