Figures & data
Figure 1. A map of Egypt showing AHD and the Barrage system that controls water distribution along the Nile (Source: NWRP Project, Citation2005).
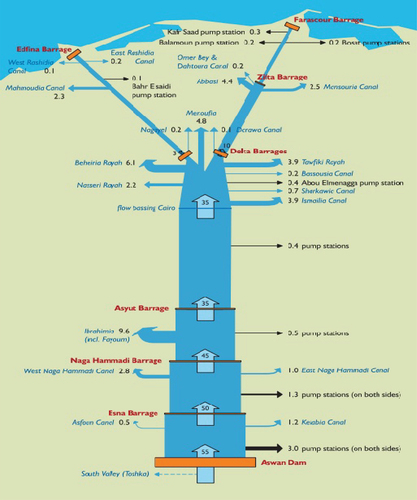
Figure 2. a: Interface “1” showing columns and rows with rectangular cells ready for doing mathematical calculations. b: Interface “2” showing part of VBA Coding.
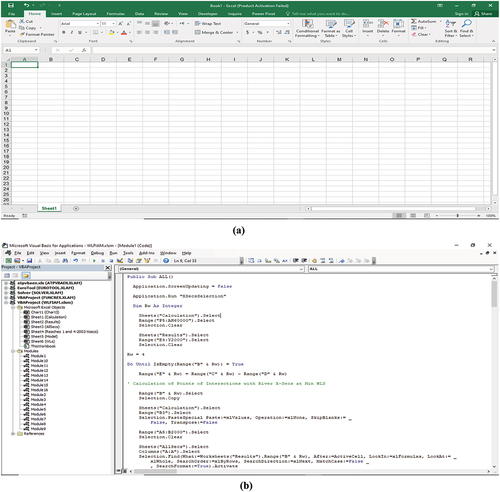
Figure 3. A definition diagram showing the information obtained by WLFIAM throughout a certain short river reach.
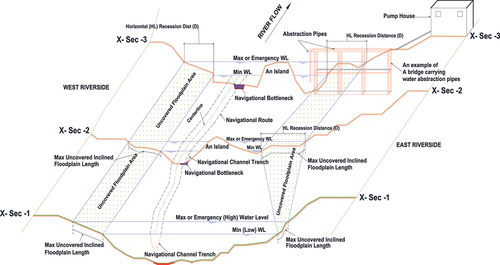
Figure 4. a: Sheet “model” showing model interface. b: sheet “results” showing final model results on the river west bank C: Sheet “AllSecs” showing x-secs data representing the river reach under study. d: Sheet “WLs” showing high and low WLs at x-secs. e: Sheet “Calculation” showing how the number of points of intersections at each WL are obtained at each x-sec. f: Sheet “Chart1” showing a chart for an optional x-sec with high and low WLs and points of intersections.
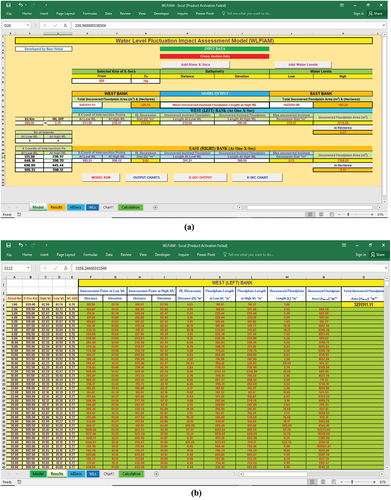
Figure 4. (Contined).
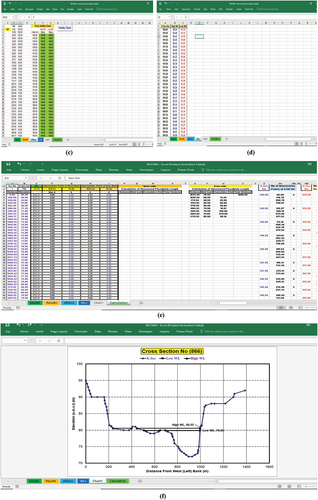
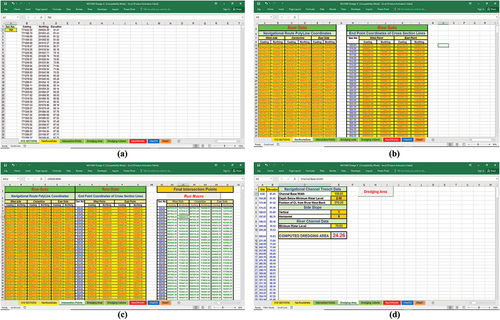
Figure 5. a: Sheet “XYZ-SECTIONS” showing x-secs data (E, N, Elevation). b: Sheet “NavRoutedata” showing navigational route and x-section end point coordinates (E, N, Elevation) c: Sheet “Intersection-Points” showing computed final intersection points between x-secs and navigational route lines (E, N, Elevation). d: Sheet “Dredge Area” showing data of a x-sec and these of a navigational channel ditch (trapezoid) e: Sheet “Dredging Volume” where the different areas to be dredged are computed and the total dredge volume is obtained. f: Sheet “NavChpoints” showing the coordinates of the final points representing the area to be dredged and the x-sec data to be plotted on a chart. g: Sheet “Chart” where a chart for a selected x-sec is plotted showing the area to be dredged. h: Sheet “Sheet1” where the calculation of the area to be dredged is done.
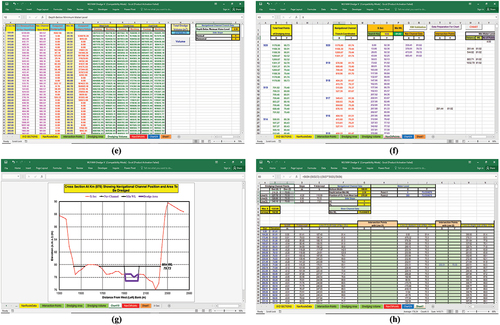
Figure 6. Map of Egypt showing the study area (Reach 1).
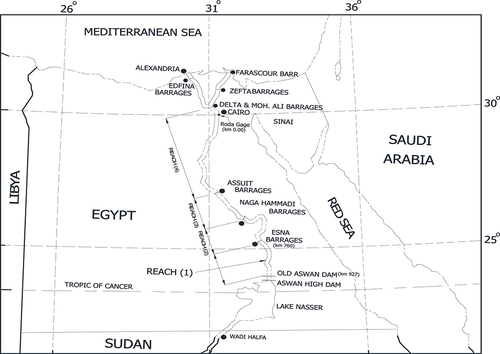
Figure 7. A 10-day average water level hydrograph at OAD Gage.
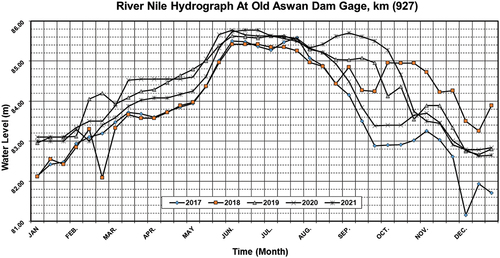
Figure 8. Water Level Profiles throughout the study reach between OAD and Esna Barrages.
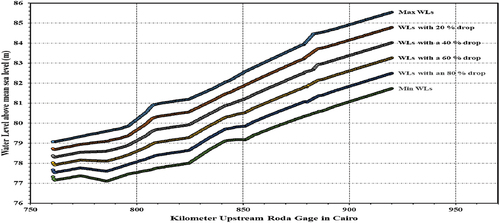
Table 1. Water Level Profiles throughout the study reach between OAD and Esna Barrages.
Figure 9. (a).Horizontal recession distance at river West side. (b).Horizontal recession distance at river East side.
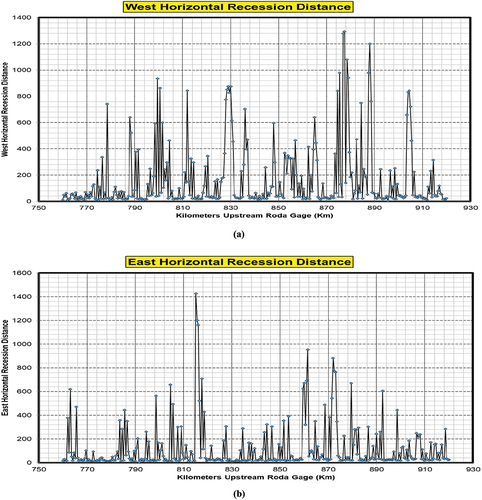
Figure 10. a: West uncovered floodplain areas at river West bank during minimum water levels. b: East uncovered floodplain areas at river East bank during minimum water levels. c: Total uncovered floodplain areas at river west bank are larger than those at the east bank during WLF over the water year.
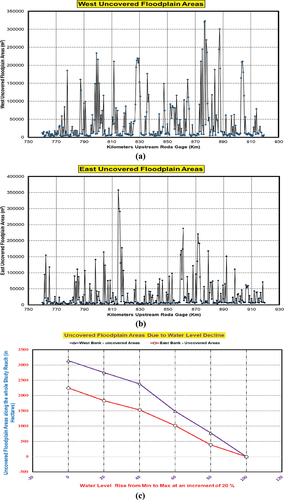
Figure 11. Number of emergent islands at each x-section along the study reach during Min & Max WLs.
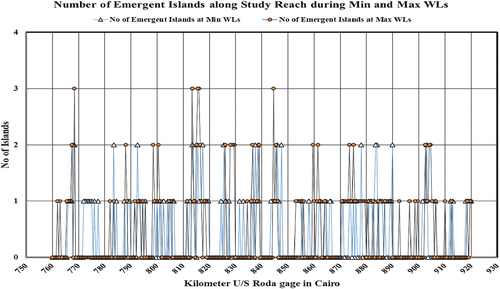
Figure 12. Locations of navigational bottlenecks and the areas to be dredged.
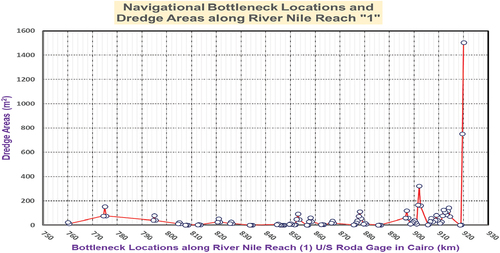
Table 2. Part of the model output table that displays the areas to be dredged at each x-section and the total dredge volume required along the study reach.
Figure A1. (A ~ c): Solution concept of dredging area computation.