
Figures & data
Figure 1. Map of the study area.
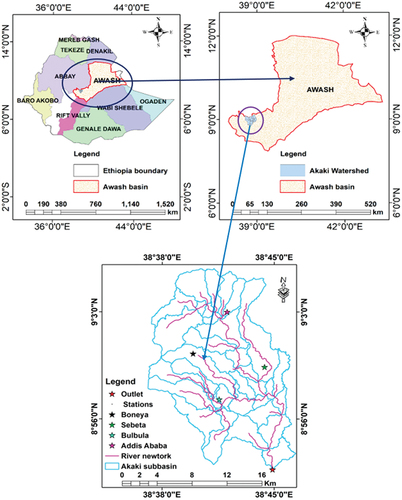
Table 1. Meteorological and spatial data used as an input for the SWAT model.
Table 2. Soil classification in the study area.
Table 3. Study area land use land cover classifications.
Figure 2. Flow chart for the Methodology.
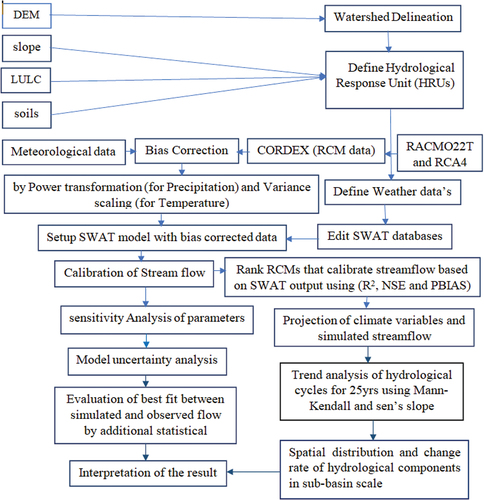
Table 4. The lists of RCMs and their driving models under RCP8.5 and RCP4.5 scenarios.
Table 5. Flow parameters ranked according to their sensitivity from SWAT output.
Table 6. Parameters used for calibration and their lowest to the highest boundary condition.
Figure 3. Scatter plot of measured and simulated streamflow from RACMO22T and RCA4 models.
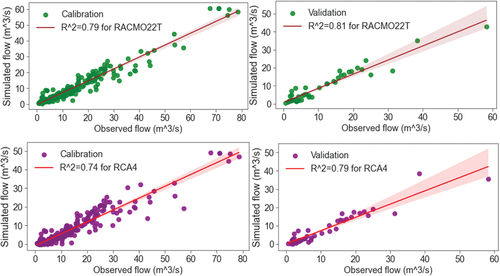
Figure 4. Calibration and validation of streamflow using two strongly performed models.
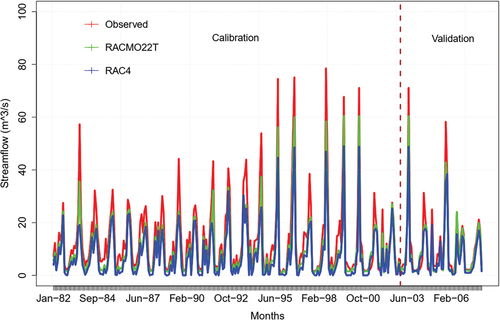
Table 7. SWAT and RCM’s performance evaluation using an objective function.
Table 8. Times series-based performance assessment of RCMs for measured against simulated.
Table 9. Statistical relationship of observed and simulated streamflow by frequency-based metrics.
Figure 5. Mann–Kendall test (significance level 0.05) and Sen’s slope (β > 0 increasing trend and β < 0 decreasing trend) for annual variability analysis.
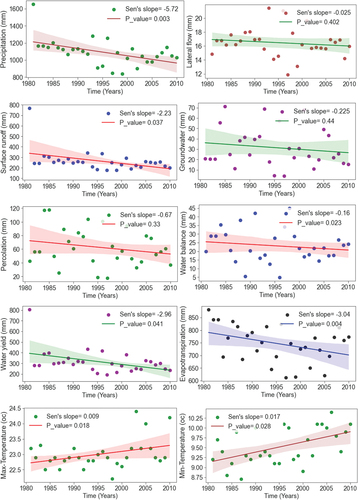
Table 10. Correlation coefficients of major hydrological components.
Figure 6. The interpolated spatial variability maps of mean annual hydrological components at the subbasin scale.
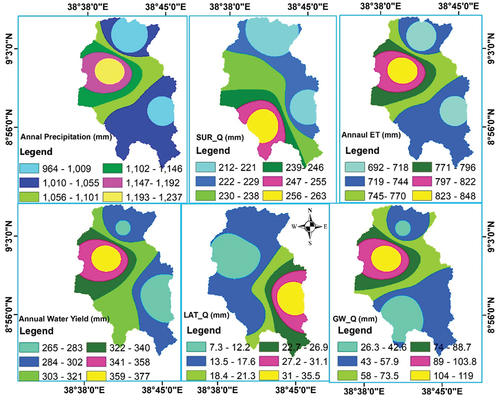
Figure 7. Annual analysis of rainfall based on the rainfall season’s occurrences at stations.
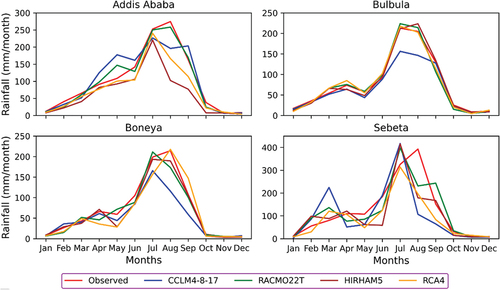
Figure 8. The trends of maximum temperatures in the baseline period for each synoptic stations.
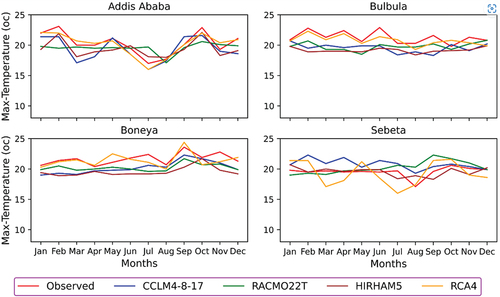
Table 11. Percentage change in rainfall projection for both scenarios by season.
Figure 9. Short term, mid-term, and long-term projections of rainfall under RCP4.5 and RCP8.5 scenarios.
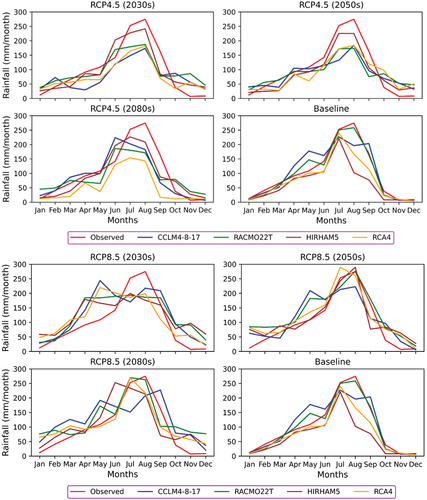
Figure 10. Monthly changes of projected rainfall based on baseline for all RCM under each scenario.
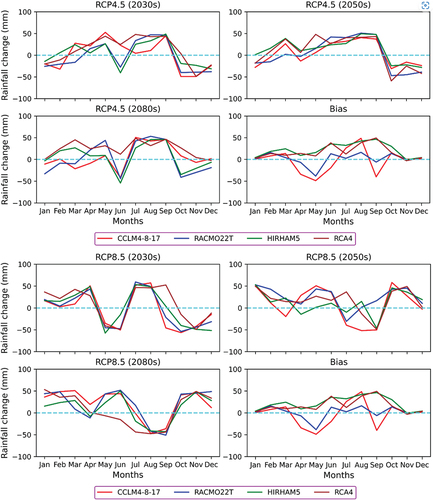
Figure 11. Maximum temperature projections in the future under RCP4.5 and RCP8.5 scenarios.
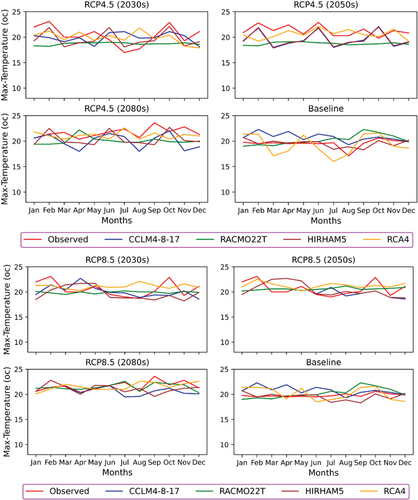
Figure 12. Monthly changes of projected maximum temperatures for all RCMs under each scenario.
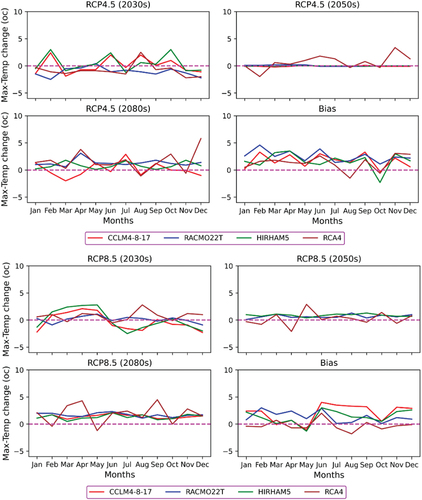
Table 12. Simulated streamflow for short, mid, and long term projected for both scenarios.
Figure 13. Projected streamflow changes for each season under RCP4.5 and RCP8.5 scenarios.Note: B-baseline period
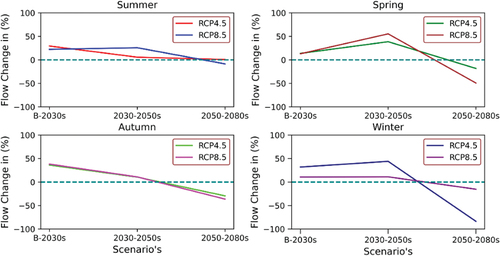
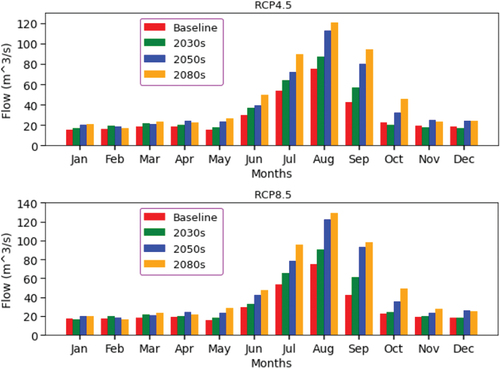
Figure 14. The projected stream flow from the reference discharge for the future scenario.
Data availability statement
All necessary data used in this research paper were incorporated and included. More supplementary data will be supplied upon request.