Figures & data
Figure 1. Layout of Dirout Group Regulators (DGRs) from Google Earth.
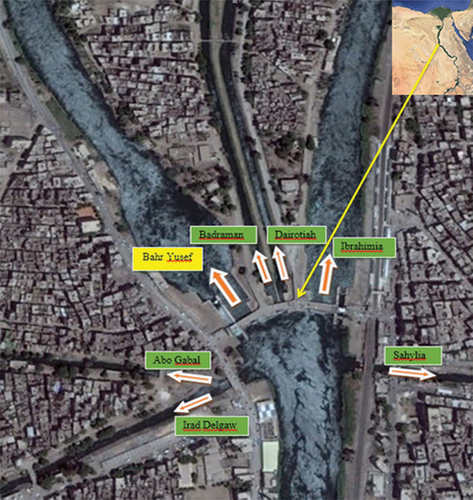
Figure 2. 2D flume in the hydraulic laboratory of the hydraulics research institute (hri), Egypt.
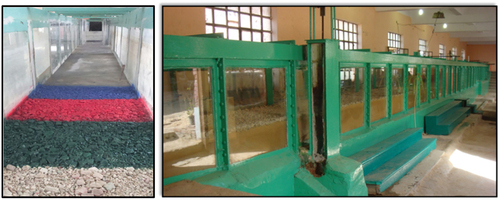
Figure 3. Longitudinal view of the physical model of the new regulator in the flume.
Figure 4. Plan view of the physical model of the new regulator in the flume.
Figure 5. Plan section of Bahr Yousef new regulator.
Figure 6. Longitudinal section of the proposed design new Bahr Yousef regulator.
Figure 7. Locations of the velocity profiles.
Table 1. Test Program for Cases 1, 2, 3, and 4.
Figure 8. Comparison of velocity distribution between Flow over and under Gate at dominant discharge, Case 1.
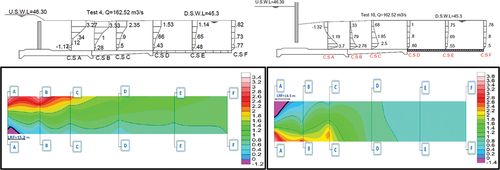
Figure 9. Comparison of velocity distribution between Flow over and under Gate at dominant discharge, Case 2.
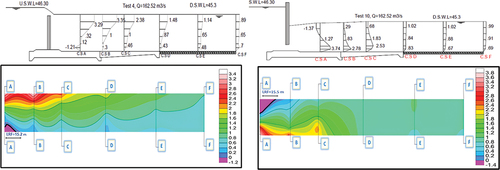
Figure 10. Comparison of velocity distribution between Flow over and under Gate at dominant discharge Case 3 and 4.
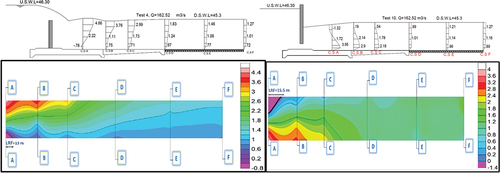
Figure 11. Locations of Pressure Cells.
Figure 12. Pressure distribution over gate (left) and under gate (right).
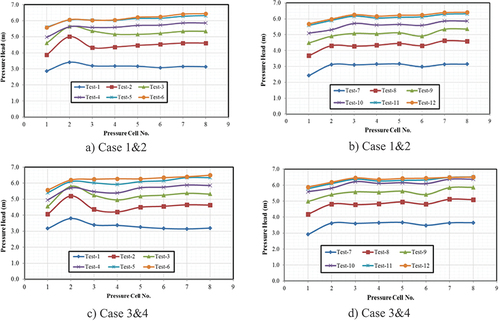
Figure 13. Flow Downstream Gate, Test2.
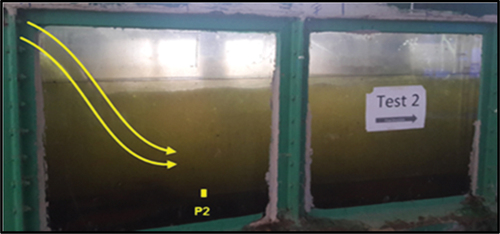
Figure 14. Flow Downstream Gate, Test 4.
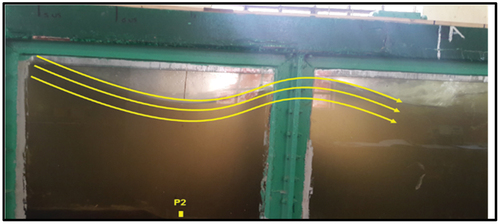
Figure 15. Water surface profile, Flow over Gate.
Figure 16. Water surface profile, Flow under Gate.
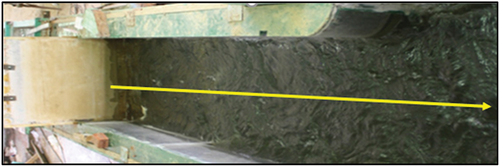
Figure 17. Parameters of the Hydraulic Jump Characteristics.
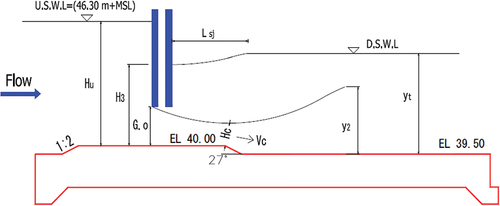
Figure 18. Relation between discharge and discharge coefficient (Flow under gate).
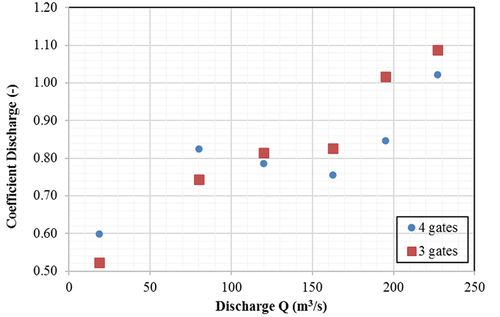
Figure 19. Relation between the sequent water depth (Y2/Y1) and the Froude No.
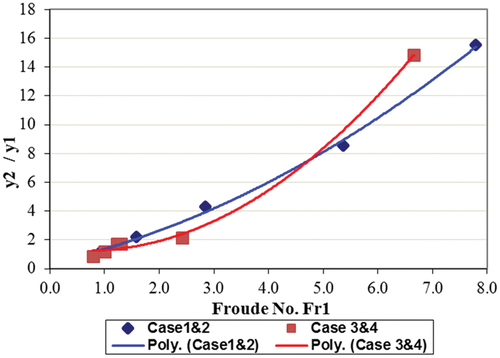
Figure 20. Relation between the relative length of submerged jump Lsj/y1 and Fraud No.
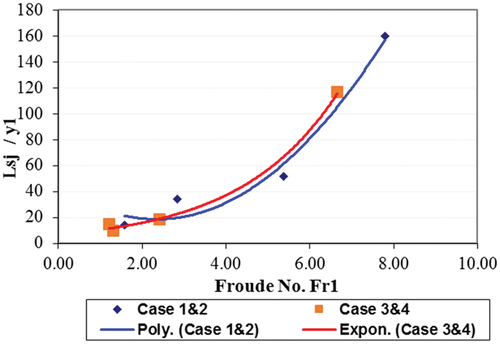
Figure 21. Relation between the Submerged ratio (H3/Y1) and the Froude No.
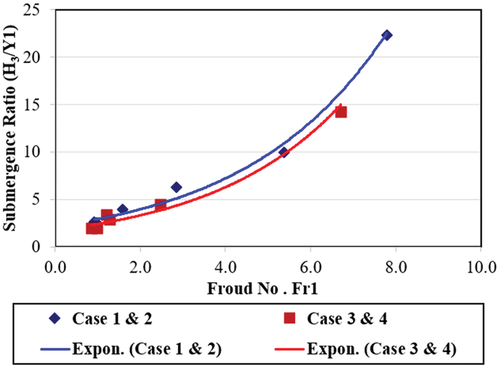
Figure 22. Relation between the jump length Lsj/y2 and Froud No.
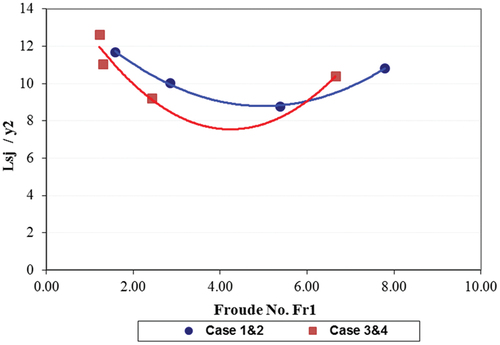
Table 2. Energy losses, flow over gate &flow under gate.
Figure 23. Relation between Froude No. and Relative Energy Losses.
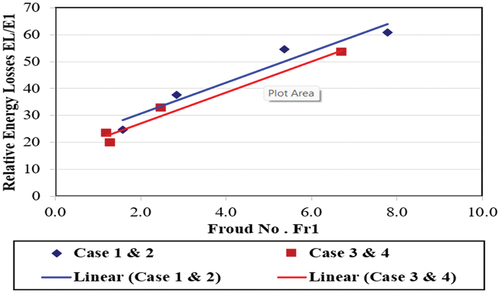
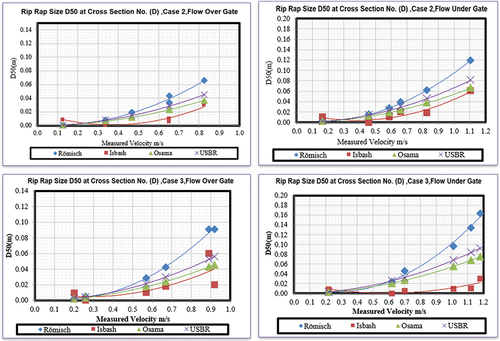
Figure 24. Relationship between velocity and Mean grain Diameter.