Figures & data
Figure 1. Location of the study area.
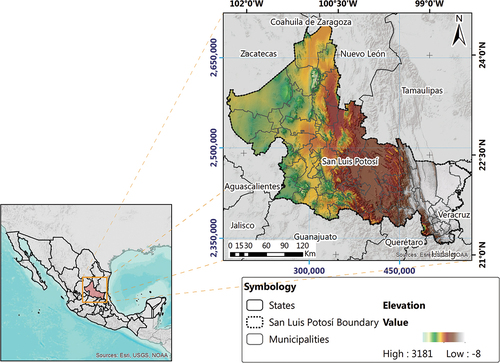
Table 1. Imagery characteristics were used in this study.
Figure 2. Rainy season’s NDWI.
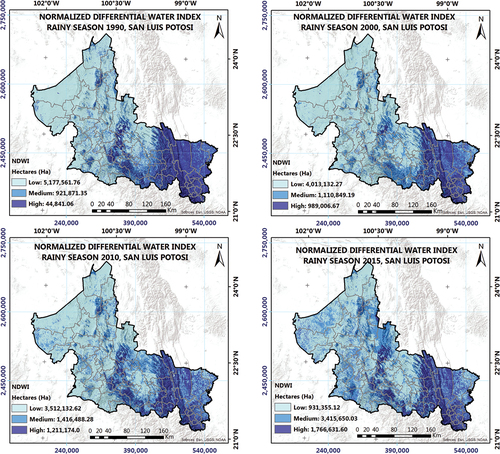
Figure 3. Dry season’s NDWI.
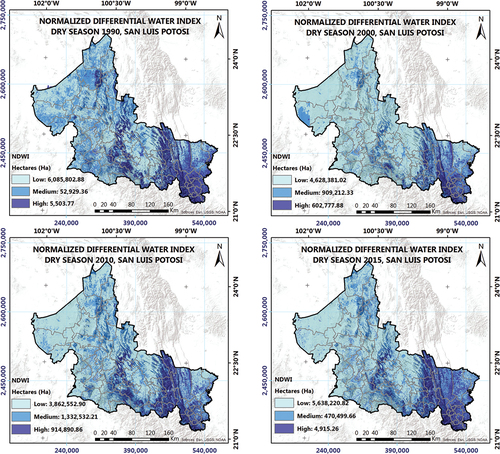
Figure 4. Distribution of the real evapotranspiration.
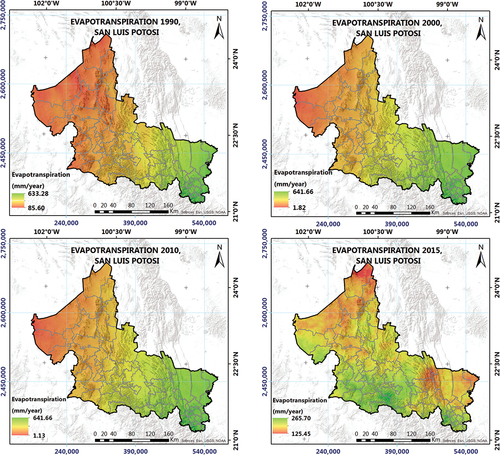
Figure 5. GDP’s spatial distribution.
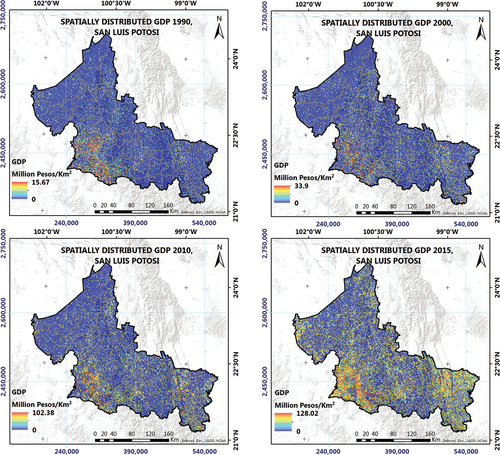
Figure 6. Spatial distribution of ESV.
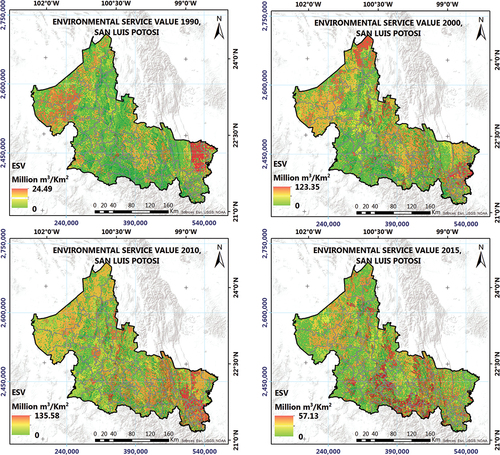
Figure 7. Land use in the study area.
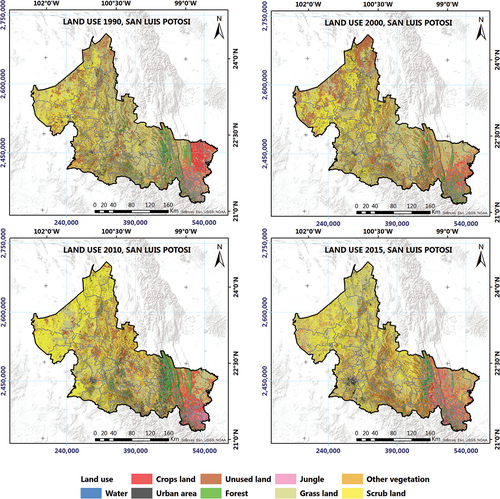
Figure 8. Spatial distribution of the WUPeconomic.
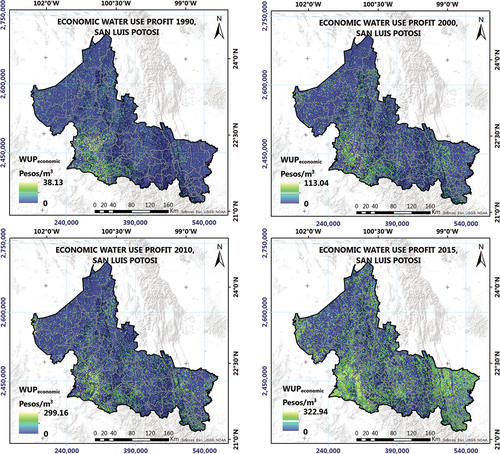
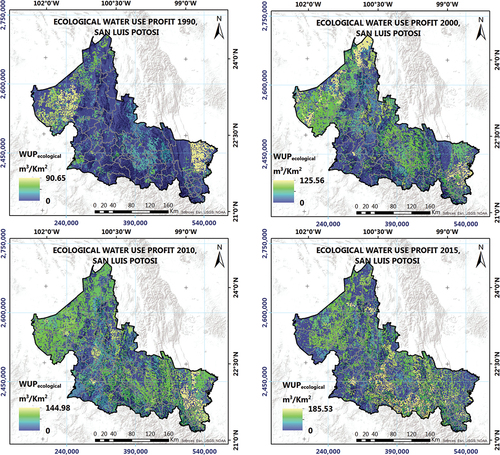
Figure 9. Spatial distribution of the WUPecological.