
Figures & data
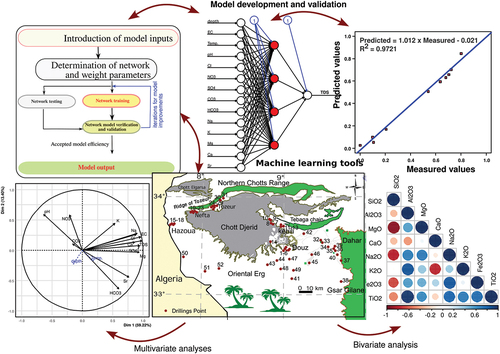
Figure 1. Simplified geological map of southern Tunisia showing the study area (a), sampling points (b) and a bloc diagram (c) of the Chott Djerid aquifer system.
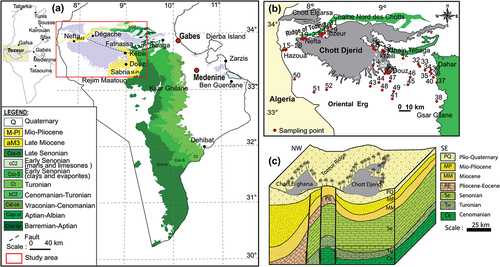
Table 1. Summarized metrics used for model validation.
Figure 2. (a) architecture of the ANN model used in this study and (b) the proposed predictive BP neural network model (modification after Bashar et al., Citation2023).
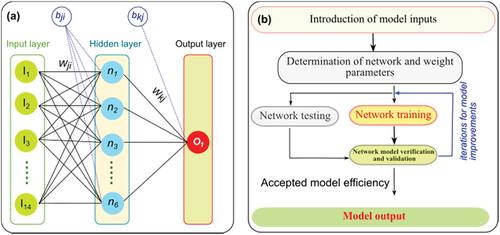
Table 2. Statistical indexes of the studied water physical-chemical properties.
Figure 3. Hierarchical cluster analysis of water samples from the Chott Djerid shallow aquifer.
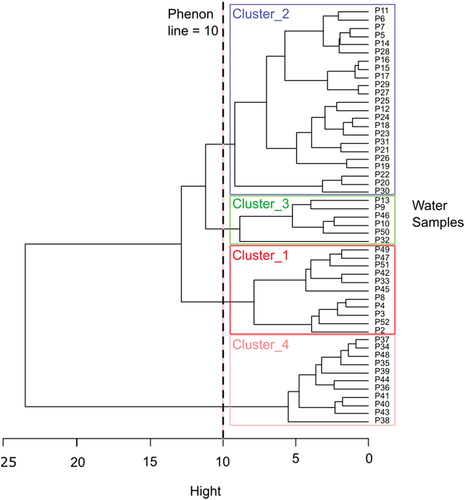
Figure 4. Boxplots for the studied geochemical parameters based on clusters.
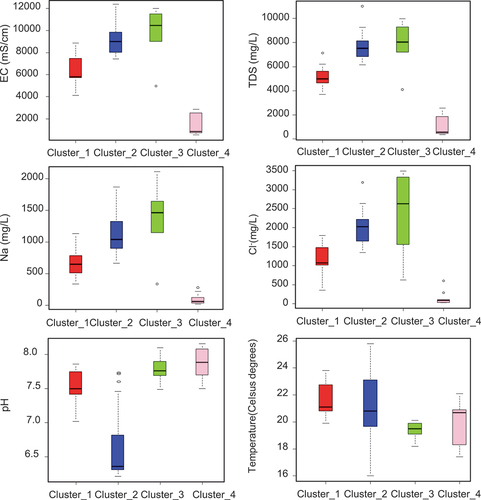
Figure 4. (Continued).
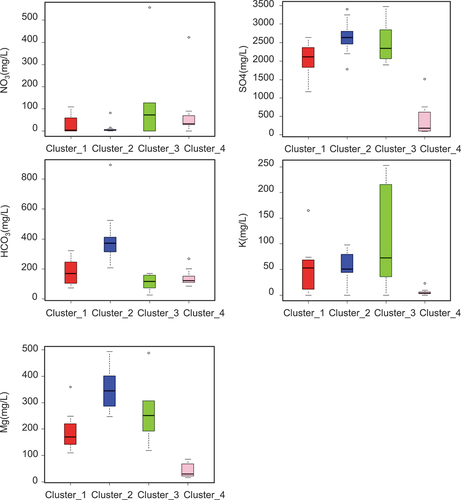
Figure 5. Pairs panels for the studied geochemical parameters.
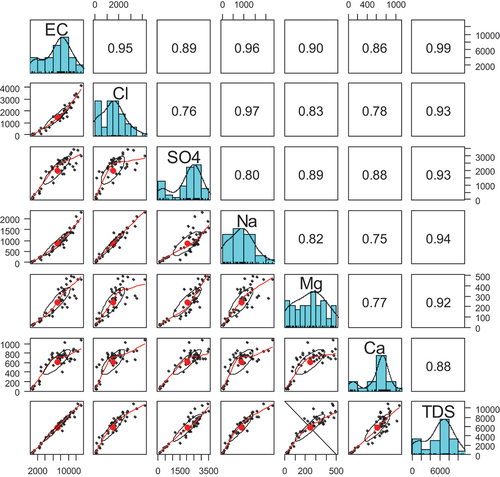
Figure 6. PCA variable factor map.
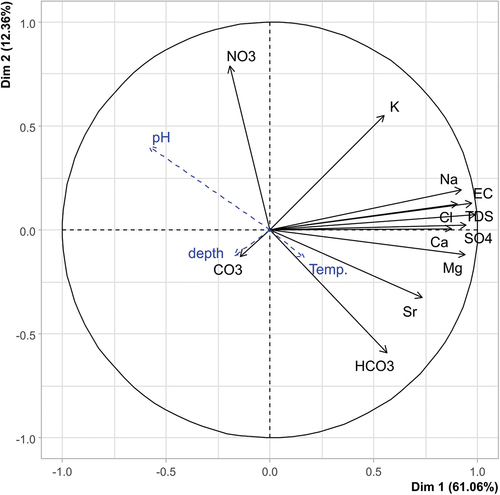
Table 3. Matrix of the main principal components and percentage of variance after variomax-rotation (n = 51).
Figure 7. Structure of the BPNN adopted in this study.
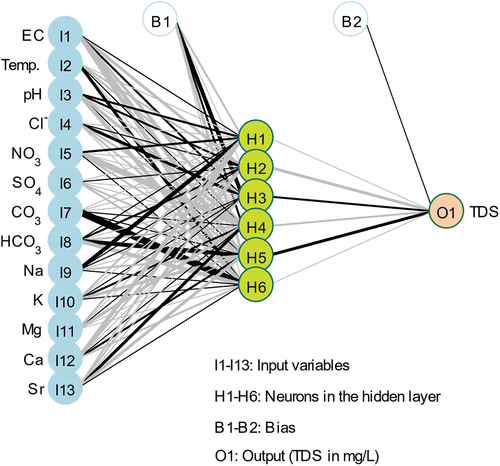
Figure 8. Fitting the predicted values from BPNN and experimental values.
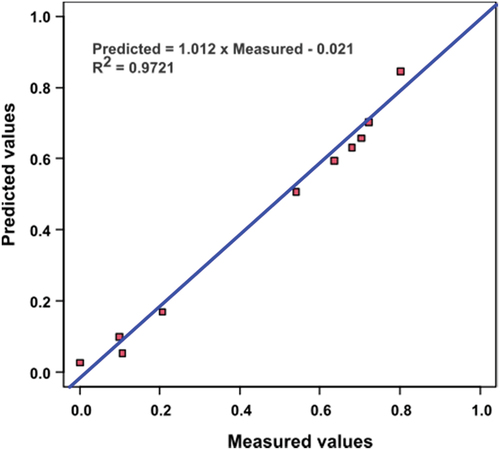
Table 4. Cross validation criteria for the proposed BPNN model.
GraphicalAbstract-WSJ.jpg
Download JPEG Image (1 MB)
Data availability statement
Data are available upon request.