
Figures & data
Figure 1. Scour profile downstream of a flip bucket.
Figure 2. A view of solid bucket.
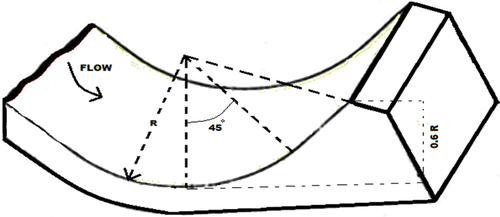
Figure 3. A sketch of a dentated bucket.
Figure 4. Schematic view of flume and installation position of the dentated flip bucket.
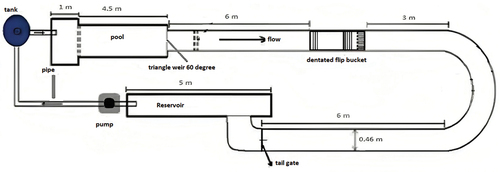
Figure 5. Sketch of dentated triangular spillway.
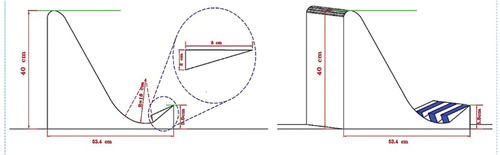
Figure 6. Properties on the spillway and riprap on the downstream.
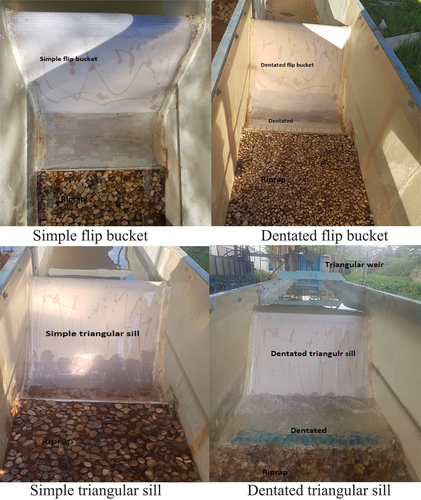
Table 1. Results of the experiment at movement threshold of riprap.
Figure 7. Investigation of the riprap stability based on the froude number at instability downstream of the spillways.
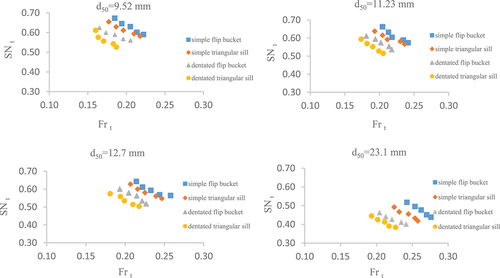
Figure 8. Relative energy loss in all of the spillways.
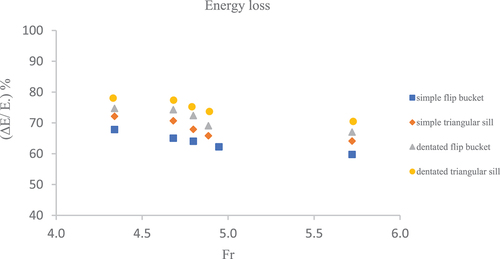
Figure 9. Comparison of the results of this study with those obtained by Steiner, Heler, Hager, and Minor (Citation2008).
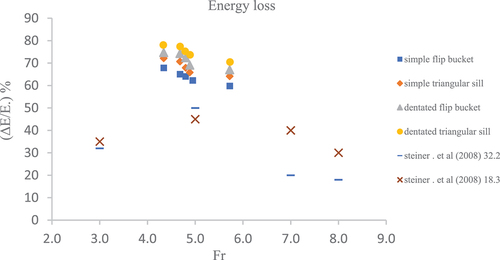
Figure 10. Investigation of the riprap stability based on the relative diameter.
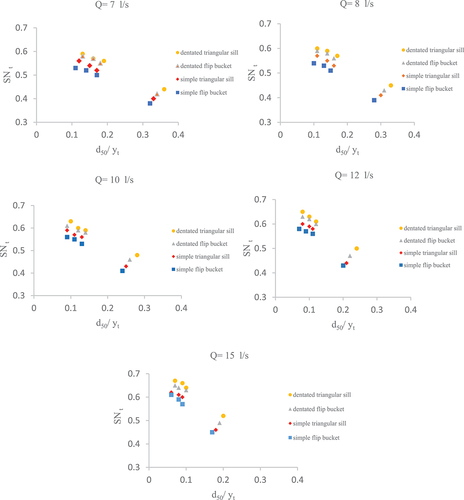
Figure 11. Comparison of the results of this study with the results obtained by some other researchers.
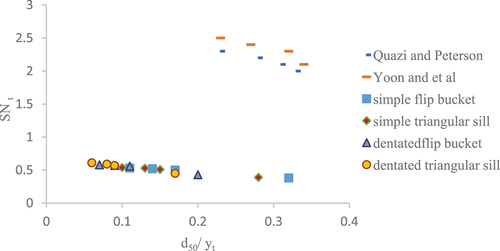
Figure 12. The effect of relative particle diameter based on the froude number.
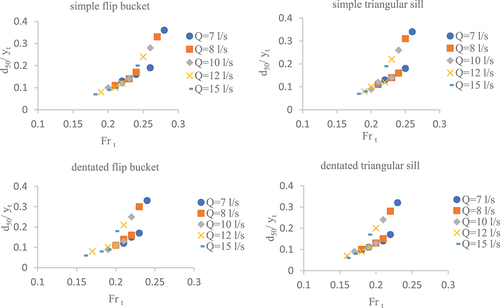
Table 2. Estimating the parameters of eq. (4), for the four spillways categories studied.
Table 3. The statistical analysis of the suggested equations for estimation of the relative particle diameter.
Figure 13. Correlation between the measured relative particle diameters and the values calculated.
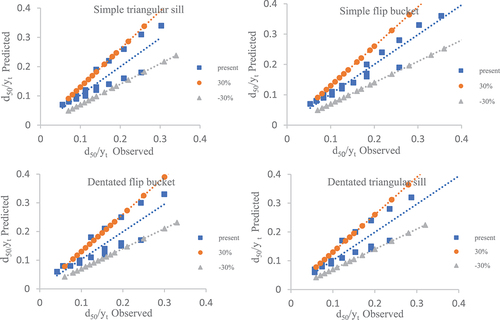
Table 4. Comparison of the results of the present study with those of the other researchers.