Figures & data
Figure 1. Case study area.
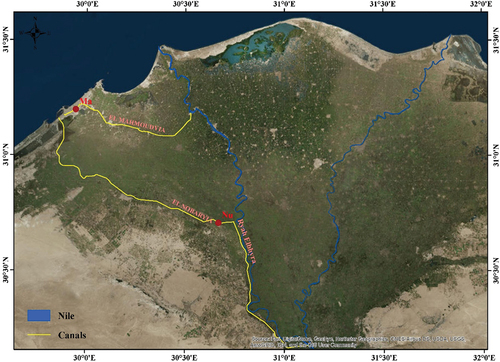
Table 1. Description of used GCMs from IPCC’s fifth assessment report (AR5), (Flato et al., Citation2014).
Figure 2. Historical climate data for both Nu and Ma.
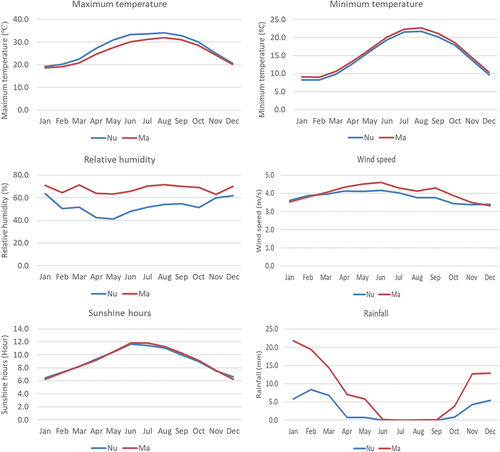
Figure 3. Monthly maximum temperature, minimum temperature, rainfall at Nu for both RCP 4.5 and RCP 8.5 (10-years intervals).
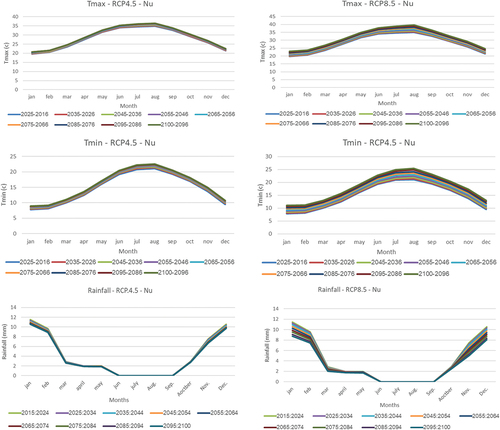
Figure 4. Monthly maximum temperature, minimum temperature, rainfall at Ma for both RCP 4.5 and RCP 8.5 (10-years intervals).
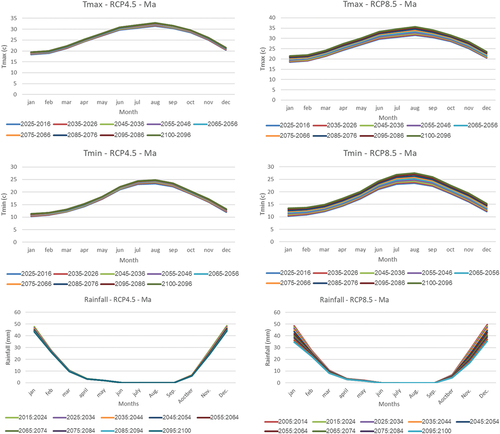
Figure 5. Projected reference evapotranspiration (ET0) for Nu, (a) using RCP4.5, (b) using RCP8.5.
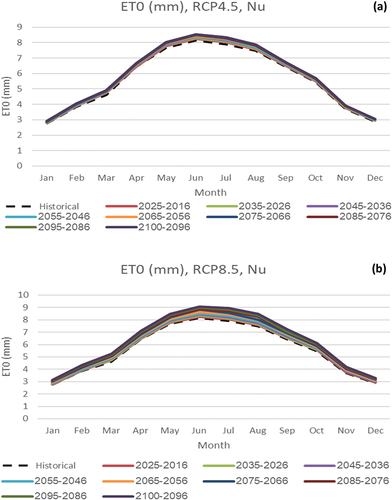
Figure 6. Projected reference evapotranspiration (ET0) for Ma, (a) using RCP4.5, (b) using RCP8.5
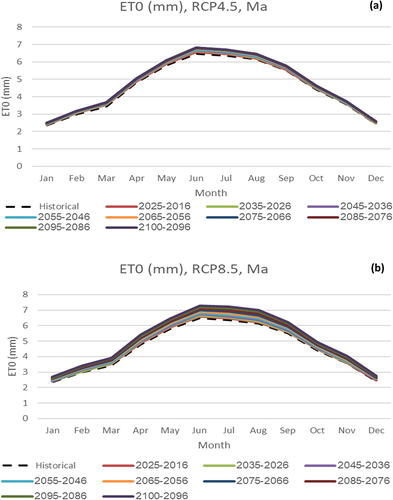
Figure 7. Results of historical and mean projected crop water requirements for Nu.
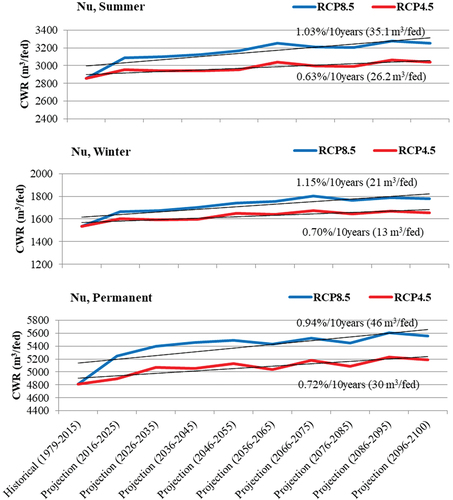
Table 2. Historical and increasing projection rates of ET0 in Nu and Ma under RCP4.5 and RCP8.5.
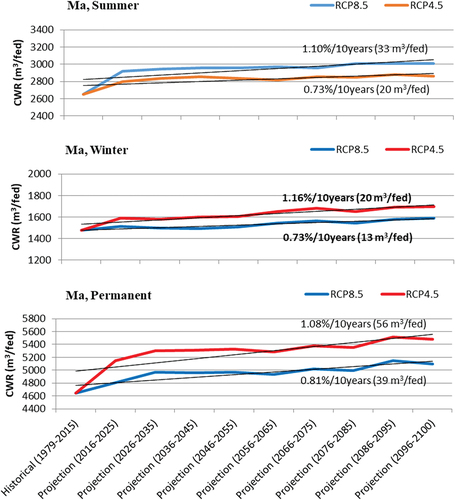
Table 3. Historical and projected CWR for summer, winter and permanent crops in Nu and Ma under RCP4.5 and RCP8.5.
Figure 8. Results of historical and mean projected crop water requirements for Ma.