Figures & data
Figure 1. Definition sketch for experimental model.
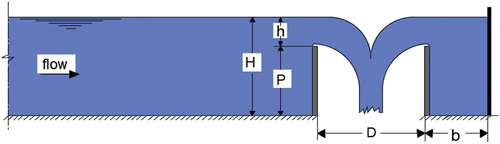
Figure 2. Layout of the experimental set up.
Figure 3. Locations at which the velocity in three dimensions was measured by the ADV.
Figure 4. A sketch of well weir models used in the present study: a) circular well weir models, b) square well weir models.
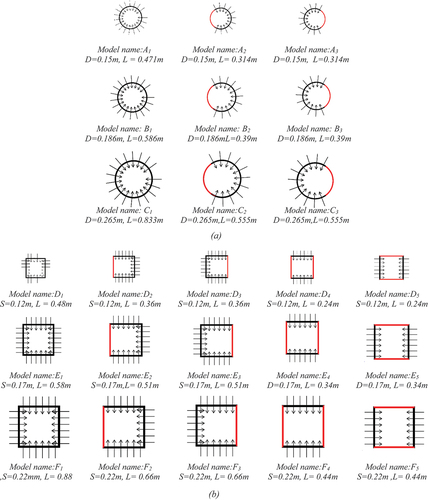
Photo 1. samples of used models.
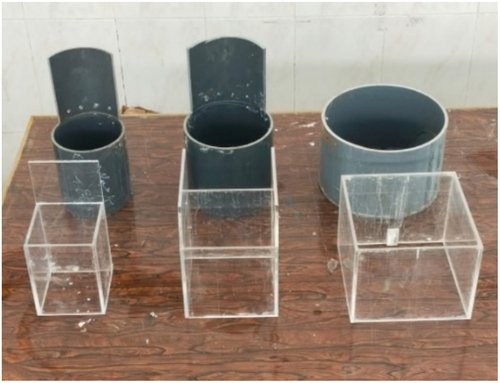
Table 1. Ranges of variables in the present study.
Figure 5. Velocity vectors around circular weir with full-length crest.
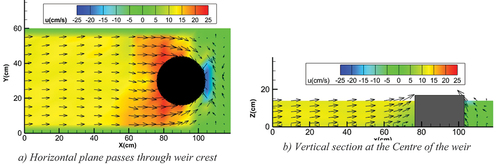
Figure 6. Velocity vectors around circular weir of two-thirds crest at downstream.
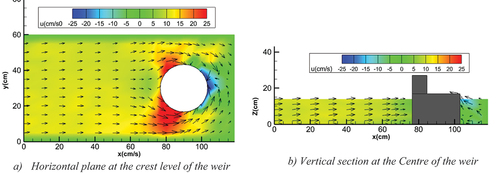
Figure 7. Velocity vectors around circular weir of two-thirds crest at upstream.
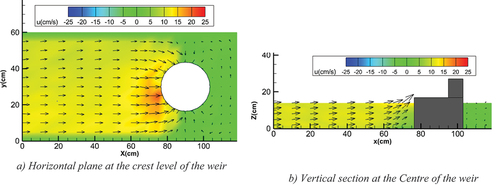
Figure 8. Velocity vectors around a square weir of full-length crest for Q = 15.48 L/s.
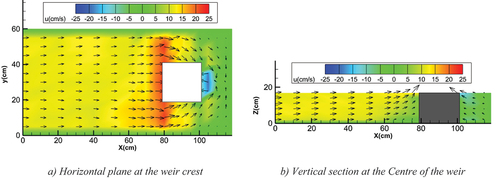
Figure 9. Velocity vectors around a square weir with three-sides crest at downstream for Q = 15.48 L/s.
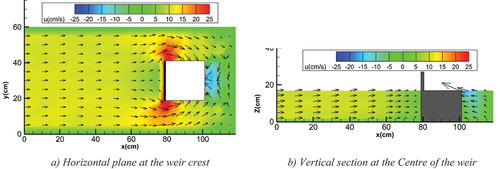
Figure 10. Velocity vectors around a square weir with three-sides crest at upstream for Q = 15.48 L/s.
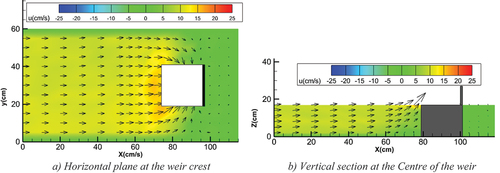
Figure 11. Velocity vectors around a square weir with two sides-crest (right and left) for Q = 15.48 L/s.
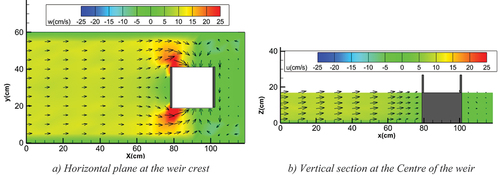
Figure 12. Velocity vectors around a square weir with two-sides crest (upstream and downstream) for Q = 15.48 L/s.
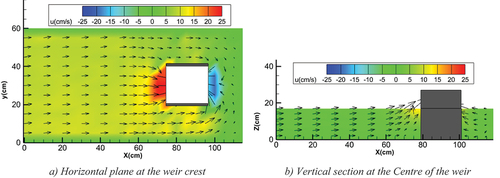
Figure 13. Variation of Q with h/p for a circular well-escape weirs with a constant diameter (D = 15 cm) and various flow directions.
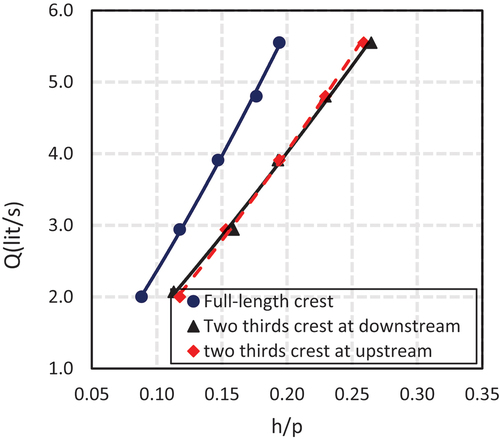
Figure 14. Variation of Q with h/p for a circular well-escape weirs with a constant diameter (D = 18.7 cm) and various flow directions.
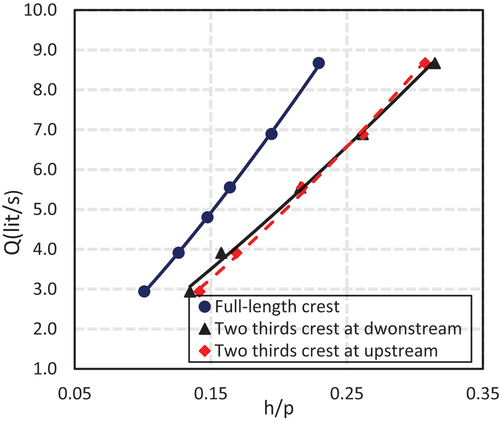
Figure 15. Variation of Q with h/p for a circular well-escape weirs with a constant diameter (D = 26.5 cm) and various flow directions.
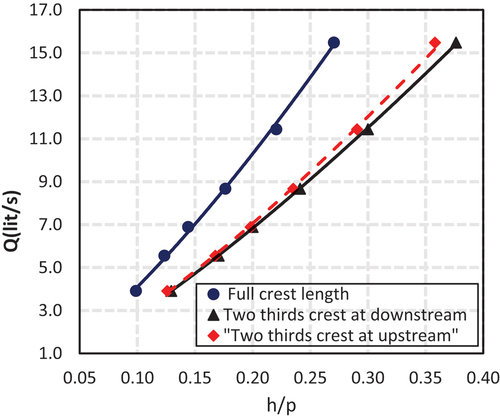
Figure 16. Variation of Q with h/p for a square well-escape weirs with a constant side length (S = 12 cm) and various flow directions.
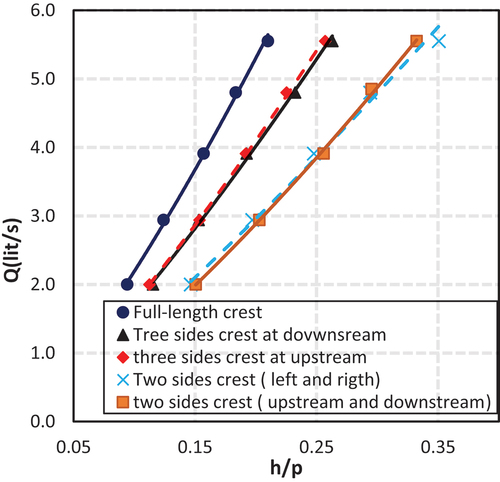
Figure 17. Variation of Q with h/p for a square well-escape weirs with a constant side length (S = 17 cm) and various flow directions.
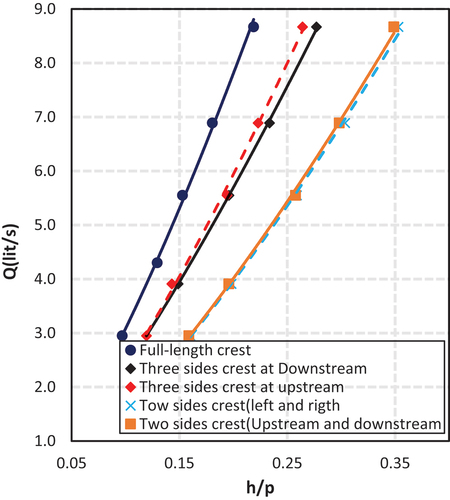
Figure 18. Variation of Q with h/p for a square well-escape weirs with a constant side length (S = 26.5 cm) and various flow directions.
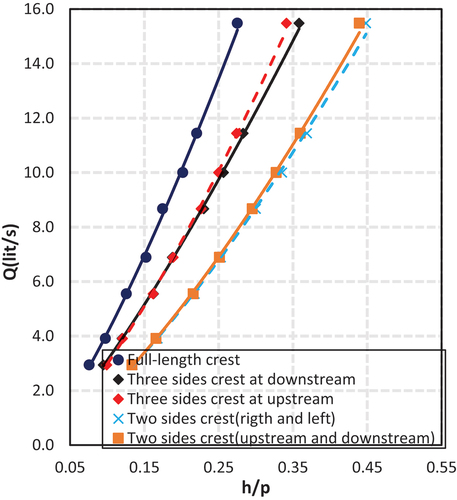
Figure 19. Variation of q with h/p for circular and square well-escape weirs of constant weir height and flow along the total length of crest perimeter.
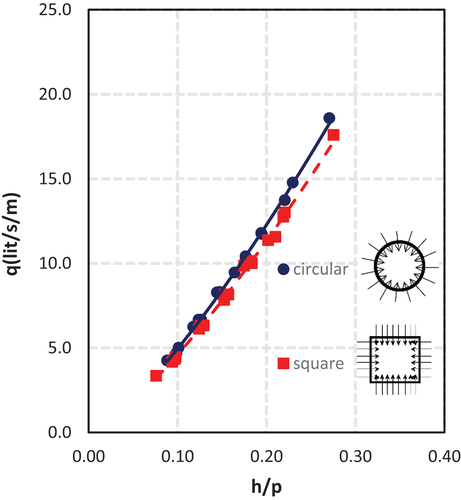
Figure 20. Variation of q with h/p for circular and square well-escape weirs of constant weir height and flow from downstream.
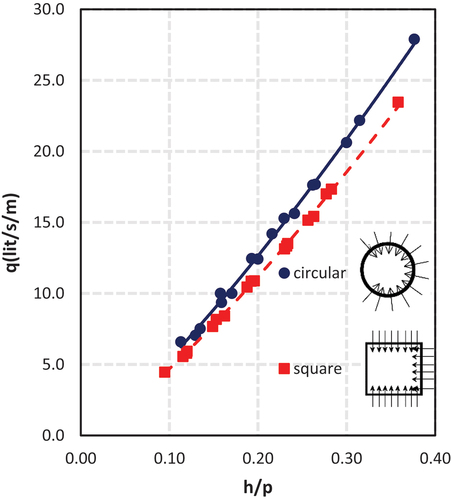
Figure 21. Variation of q with h/p for circular and square well-escape weirs of a constant weir height and flow from upstream.
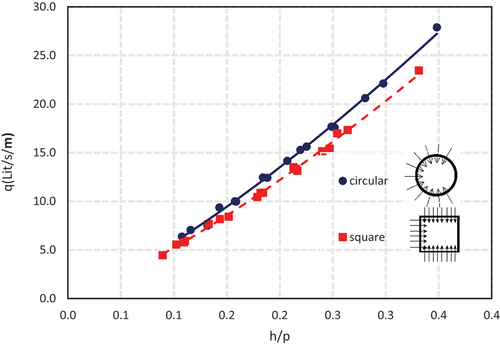
Figure 22. The variation of the relative increase in circular weir’s discharge capacity over that of square weir with h/p.
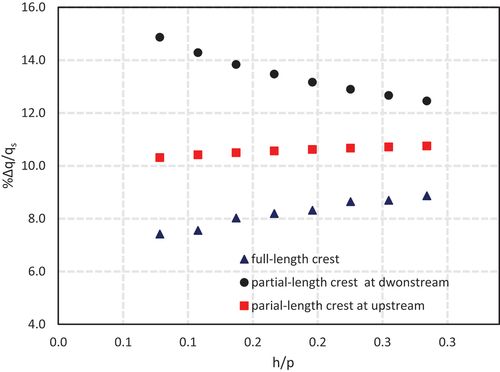
Figure 23. The variation of relative difference in the discharge capacity between the weirs of full-length crest and partial-length crest.
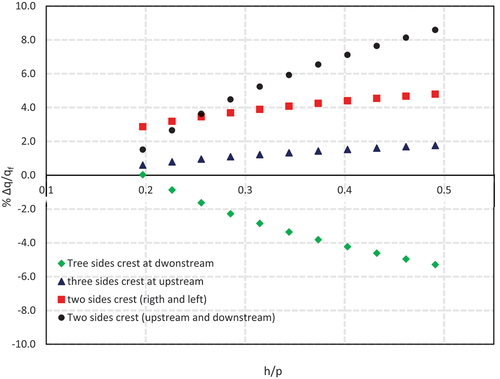
Figure 24. Variation of Qp/Qf with h/p for circular weirs of various crest position.
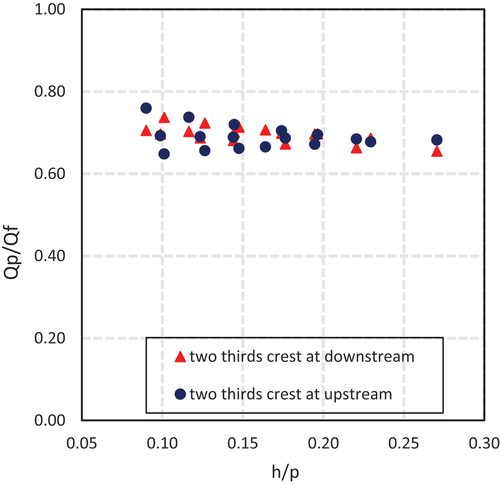
Figure 25. Variation of Qp/Qf with h/p for square weirs of various crest length and position.
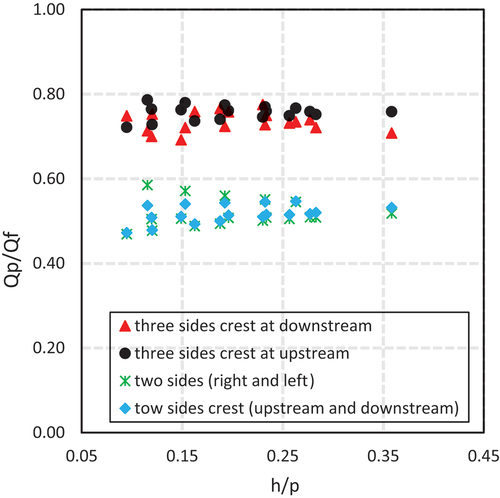
Figure 26. Variation of Cd with h/p for circular and square weirs with full-length crest.
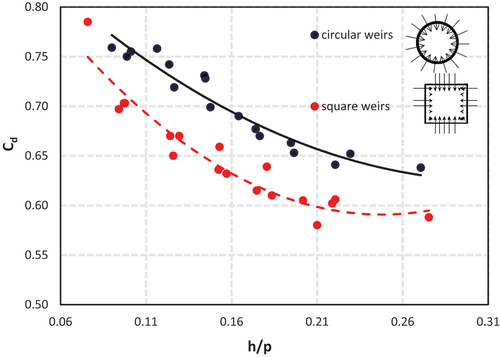
Figure 27. Variation of Cd with h/p for circular and square weirs with partial crest length from downstream.
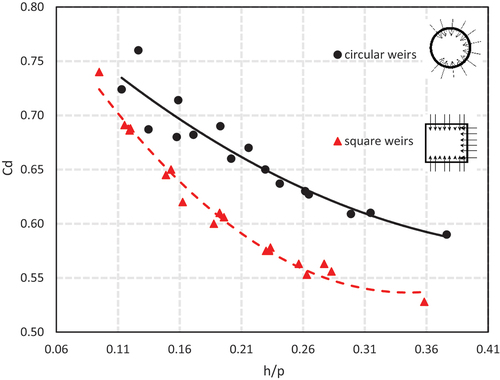
Figure 28. Variation of Cd with h/p for circular and square weirs with partial crest length from upstream.
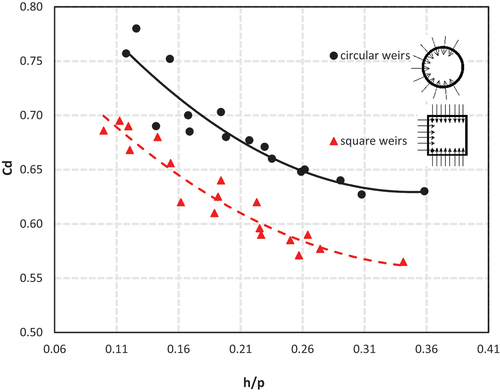
Table 2. Comparison of the average discharge coefficient of circular and square weirs with different flow directions.
Figure 29. Variation of Cd with h/p for the circular well-escape weirs for different flow directions.
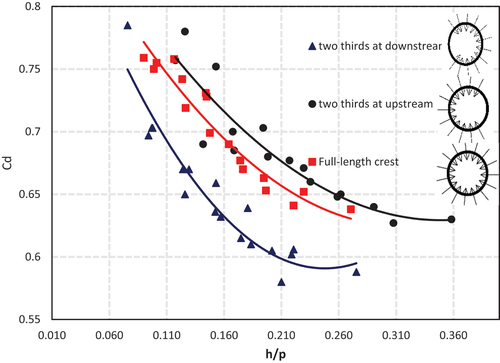
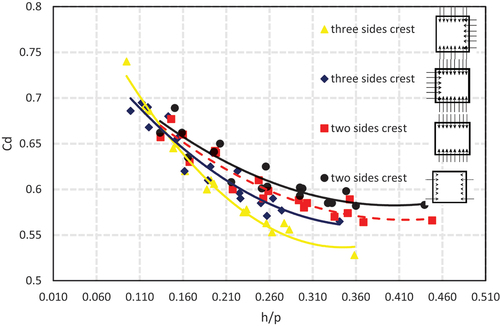
Figure 30. Variation of Cd with h/p for the square well-escape weirs for different flow directions.