
Figures & data
Figure 1. Geographical location of karkheh basin and selected rainfall stations.
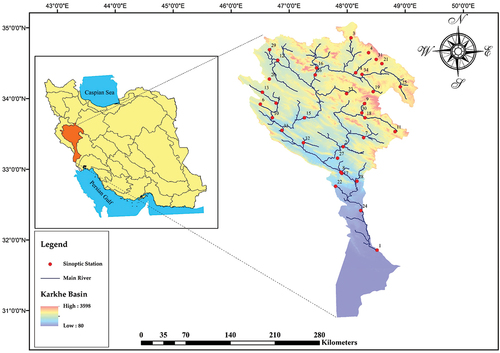
Figure 2. Rainfall time series in the rain gauge stations of Sarab Seyed Ali, Kaka Reza, Afrine (kashkan) and Pol Dokhtar.
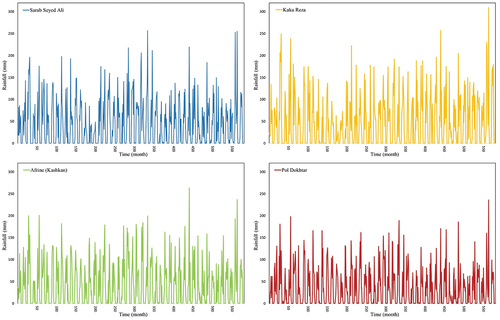
Table 1. Characteristics of selected synoptic stations in the Karkhe basin.
Table 2. Types of kernel functions (Ren, Hu, & Miao, Citation2016).
Figure 3. The general structure of the SA algorithm.
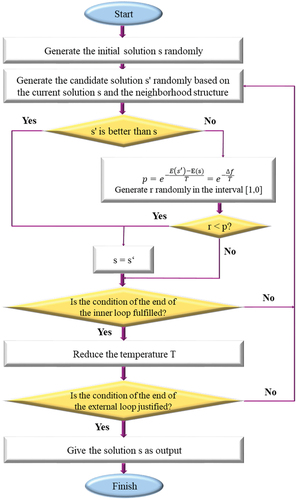
Figure 4. Flow structure of SVM-SA model (Bashar, Nozari, Marofi, Mohamadi, & Ahadiiman, Citation2023).
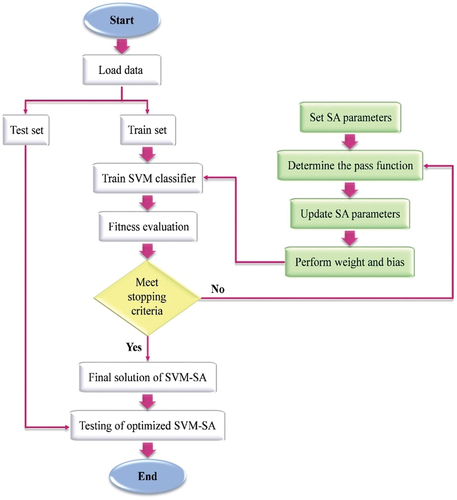
Figure 5. Structure of four machine learning systems: SISO, SIMO, MISO and MIMO.
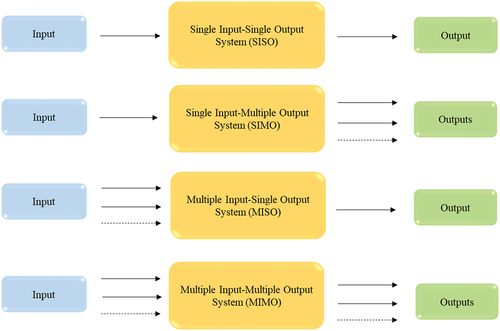
Figure 6. The framework of study identification and selection process.
Figure 7. Comparison of observed and predicted rainfall in the validation stage by Monte Carlo and Thomas Fiering models at Sarabi rain gauge station.
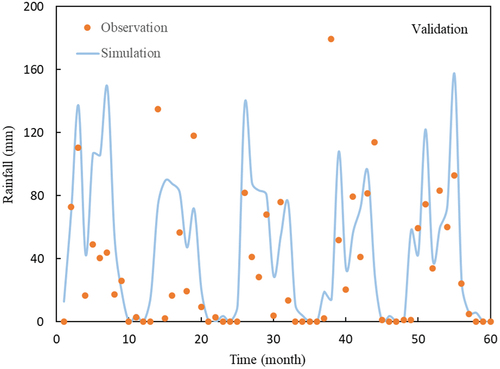
Table 3. The results related to the prediction of rainfall in the 10 studied rain gauge stations using the Monte Carlo and Thomas Fiering methods.
Figure 8. Comparison of observed and predicted rainfall in the calibration and validation stage using SIMO method and with the help of SVM-SA model in Sarabi rain gauge station.
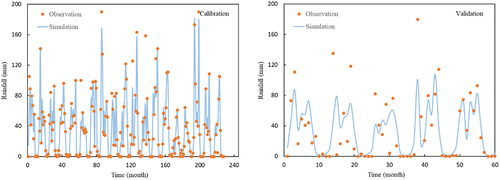
Table 4. Results related to rainfall predicting in 10 studied rain gauge stations by SIMO method and with the help of SVM-SA.
Figure 9. Comparison of observed and predicted rainfall in the calibration and validation stage using MIMO method and with the help of SVM-SA model in Sarabi rain gauge station.
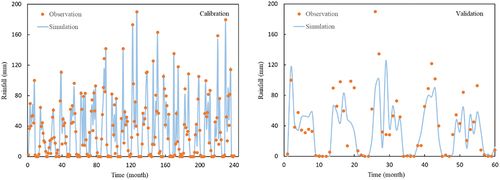
Table 5. Results related to rainfall predicting in 10 studied rain gauge stations by MIMO method and with the help of SVM-SA.
Figure 10. Comparison of observed and predicted rainfall in the calibration and validation stage using SISO method and with the help of SVM-SA model in Sarabi rain gauge station.
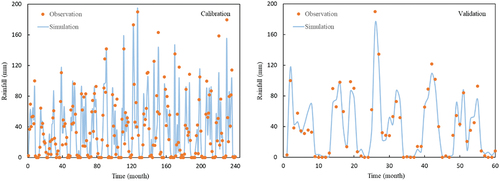
Table 6. Results related to rainfall prediction in 10 studied rain gauge stations by the SISO method and with the help of SVM-SA.
Figure 11. Comparison of observed and predicted rainfall in the calibration and validation stage using SISO method and with the help of LR model in Sarabi rain gauge station.
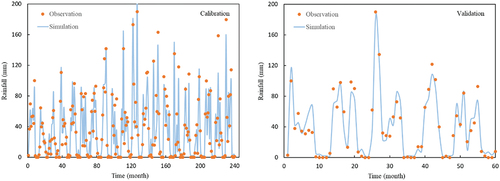
Table 7. Results related to rainfall predicting in 10 studied rain gauge stations by SISO method and with the help of LR.
Figure 12. Comparison of observed and predicted rainfall in the calibration and validation stage using the MISO method and with the help of the SVM-SA model at the Sarabi rain gauge station.
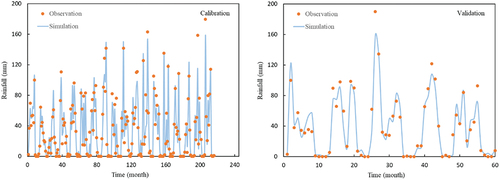
Table 8. The results related to rainfall predicting in 10 studied rain gauge stations using the MISO method and with the help of SVM-SA.
Figure 13. Comparison of observed and predicted rainfall in the calibration and validation stage using the MISO method and with the help of the MLR model at the Sarabi rain gauge station.
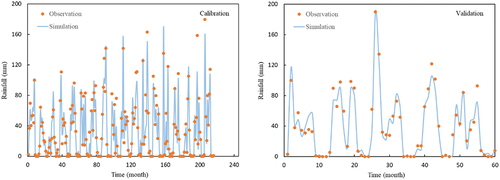
Table 9. The results related to rainfall predicting in the 10 studied rain gauge stations using the MISO method and with the help of MLR.
Table 10. Average indicators related to monthly rainfall prediction in the studied rain gauge stations.