
Figures & data
Figure 1. Identified springs in the study area.
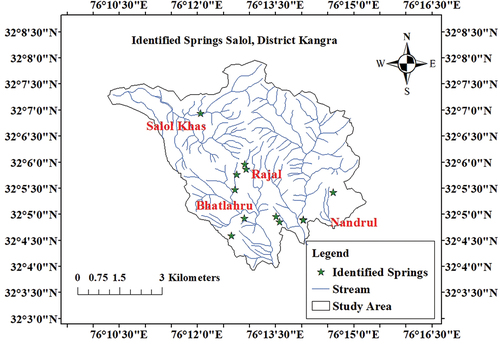
Table 1. Identified springs in the Salol region, district Kangra, Himachal Pradesh.
Figure 2. Groundwater potential zone map of the study area.
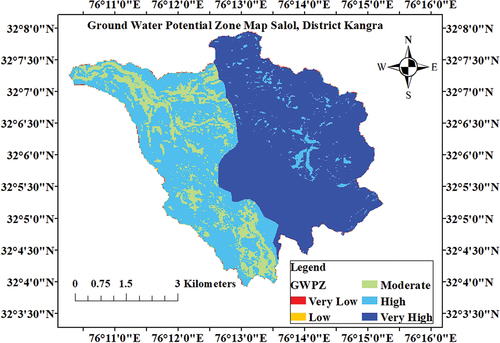
Figure 3. Methodology used for groundwater potential zone mapping.
Table 2. Categorization of factors influencing the groundwater potential zones.
Table 3. Recharge zone characteristics of the selected springs.
Figure 4. Observed pH level in the years of 2021(post monsoon) and 2022 (pre monsoon).
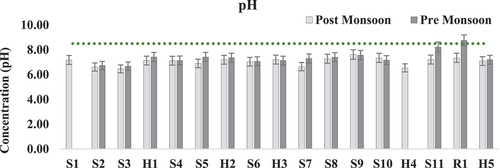
Figure 5. Observed TDS concentration in the years of 2021(post monsoon) and 2022 (pre monsoon).
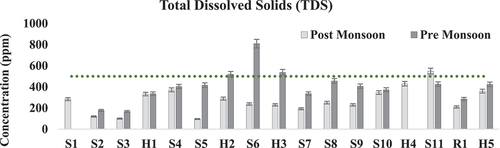
Figure 6. Observed electrical conductivity in the years of 2021(post monsoon) and 2022 (pre monsoon).
Table 4. Descriptive statistics analysis of water quality parameters pH, TDS, EC for the post-monsoon season (2021).
Table 5. Descriptive statistics analysis of water quality parameters pH, TDS, EC for the pre-monsoon season (2022).
Table 6. Correlation analysis for in-situ water quality variables for the post-monsoon season (2021).
Table 7. Correlation analysis for in-situ water quality variables for the pre-monsoon season (2022).
Figure 7. Thematic spatial maps of study area: (a) Geology; (b) geomorphology.
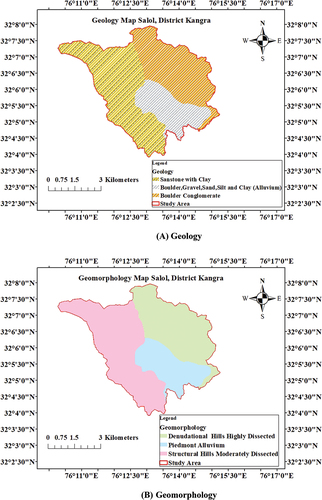
Table 8. Classification of weighted factors and their ratings influencing the potential zones in the study area.
Figure 8. Thematic spatial maps of study area: (a) Landcover/land use; (b) Slope; (c) drainage density; (d) lineament density.
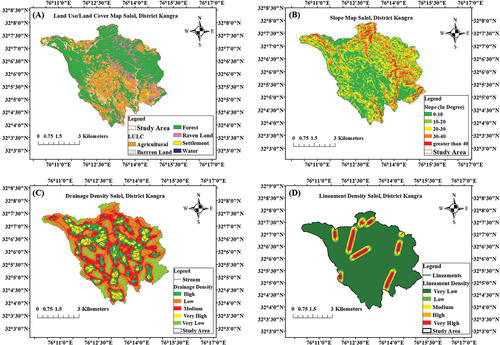
Figure 9. Time series TMAX (ºC) data from 1981–2021 for Bhatlahru region.
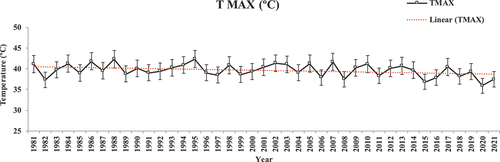
Figure 10. Time series TMIN (ºC) data from 1981–2021 for Bhatlahru region.
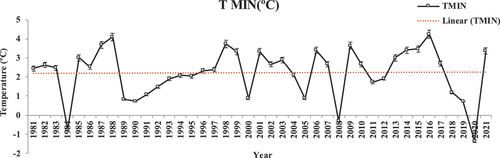
Figure 11. Time series precipitation (mm) data with effect from 1981–2021 for Bhatlahru region.
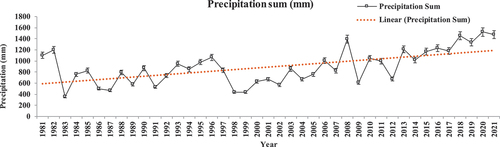
Table 9. Computed climate data for the study area from 1981–9021.
Figure 12. Hydrograph of salol boweri with respecte to the impact of artificial recharge and rainfall pattern.
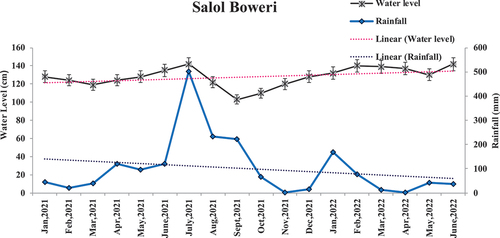
Figure 13. Hydrograph of bhatlahru boweri with respect to the rainfall pattern.
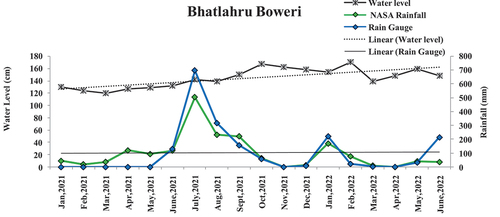
Table 10. Estimated storage of water in constructed recharge structures.
Table 11. Correlation matrix for Bhatlahru and salol spring water level with rainfall.