Figures & data
Figure 1. Locations and satellite images of study areas of El Sabeel canal in Qalyubia and El Estable canal in Sharqia, Egypt.
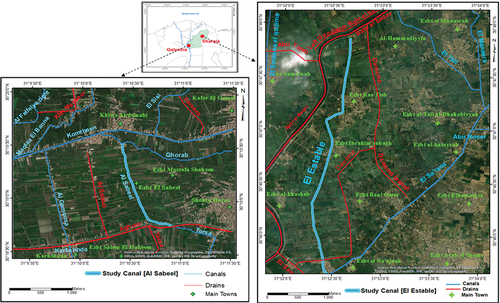
Figure 2. Top clay layer thickness at the study area of Al Sabeel canal.
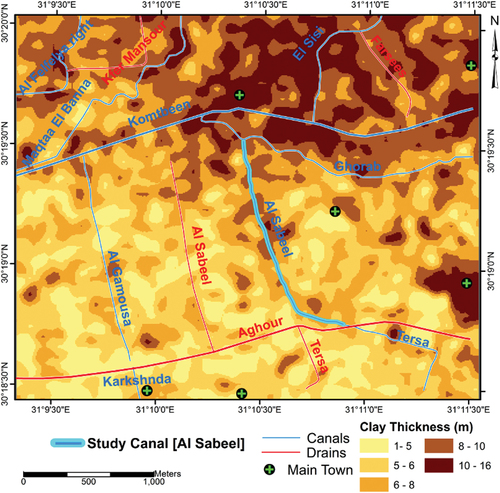
Figure 3. Base of aquifer at the study area of Al Sabeel canal (a) and El Estable canal (b).
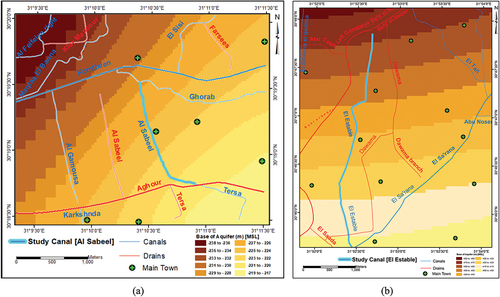
Table 1. Aquifer thickness and hydraulic parameters for simulated areas.
Figure 4. Grid Mish, installed observation wells, and production wells at El-Sabeel(a) & El-Estable (b) study areas.
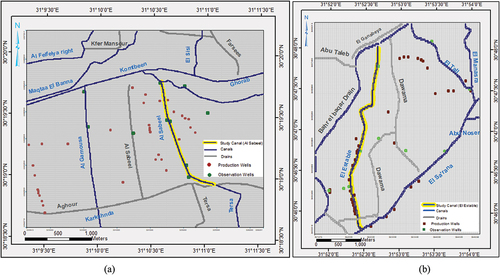
Figure 5. Horizontal cross sections A-A in El-Sabeel & B-B in El-Estable study areas.
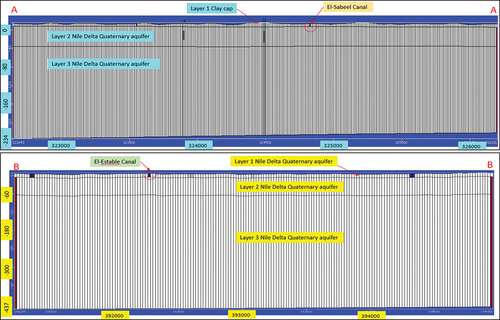
Figure 6. Observed versus calculated groundwater heads (m) for model calibration in 2021 at El-Sabeel(a) & El-Estable (b) study areas.
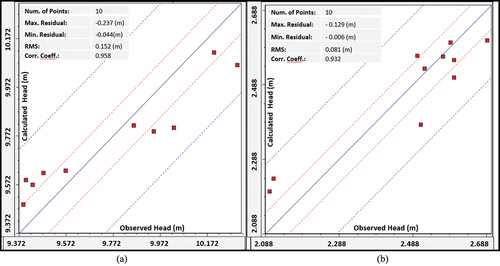
Figure 7. Calibrated groundwater head contour map and velocity distribution in 2021 for the study areas of El-Sabeel (a) and El-Estable (b).
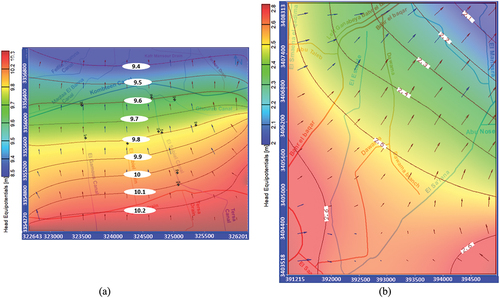
Figure 8. Water balance analysis for the calibration prior to lining El-Sabeel (a) and El-Estable (b) study areas.
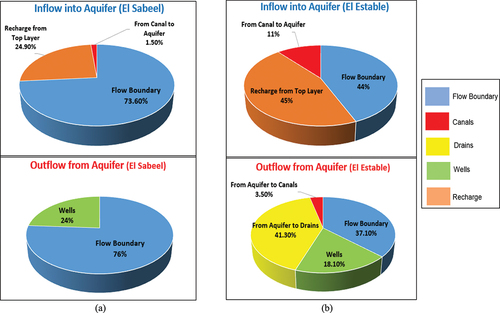
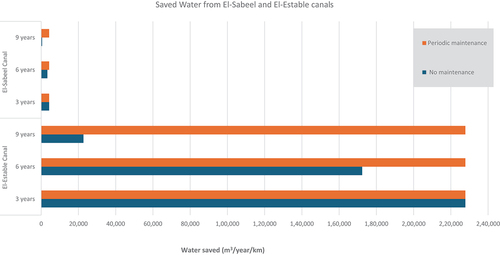
Figure 9. The amount of saved water calculated for the tested scenarios within the next 9 years from El-Sabeel and El-Estable canals.