Figures & data
Figure 1. Formed lakes in the study area.
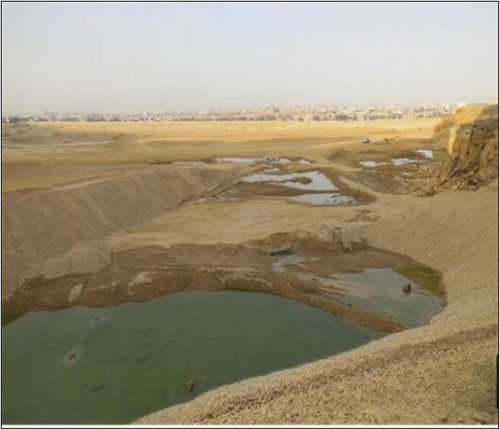
Figure 2. Research methodology for exploring the water origin.
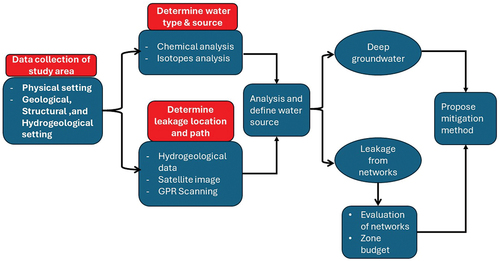
Figure 3. Location of the study area in Egypt.
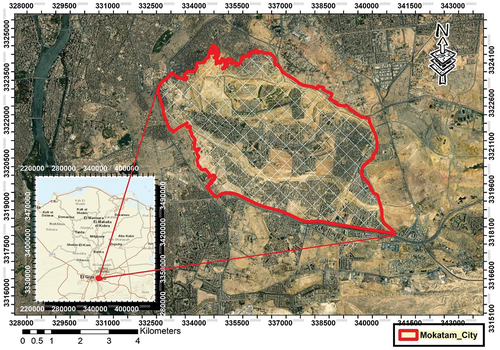
Figure 4. Topography of Mokattam Plateau. Section (1–1), southeast to northwest profile, section (2–2), northeast to southwest profile, section (3–3), south to north profile.
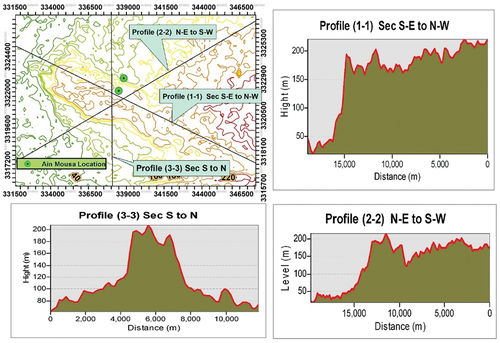
Figure 5. hydrogeological map for the study area (depicted from RIGW, 1998).
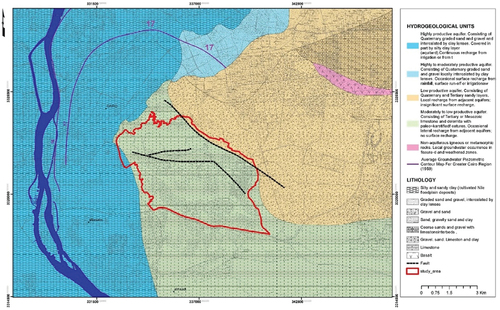
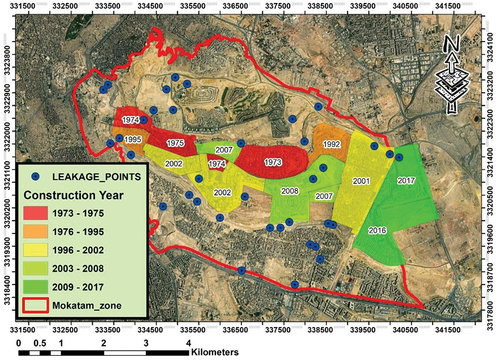
Figure 6. Leakage locations over the whole area.
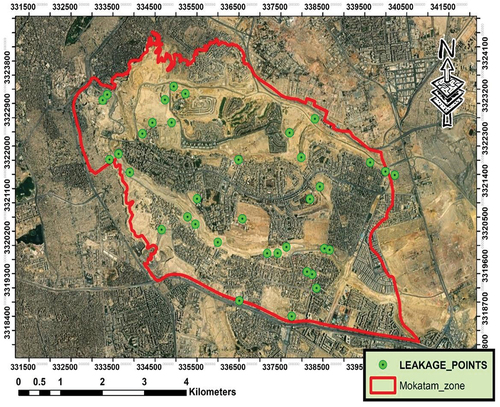
Figure 7. Effect of reshaping the landscape of the plateau on leakage location.
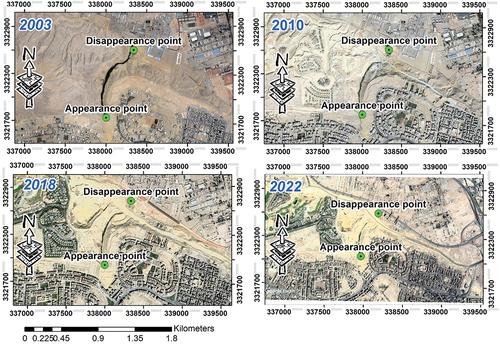
Figure 8. Locations of collected samples for chemical analysis.
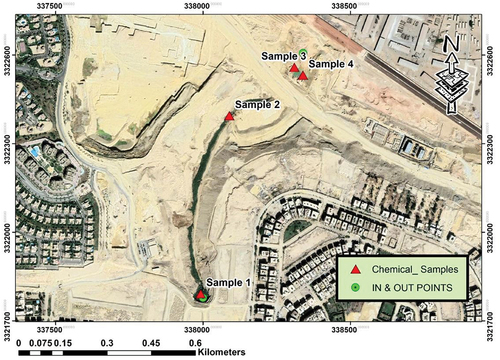
Figure 9. Water types according to piper trilinear diagrams (piper, Citation1944).
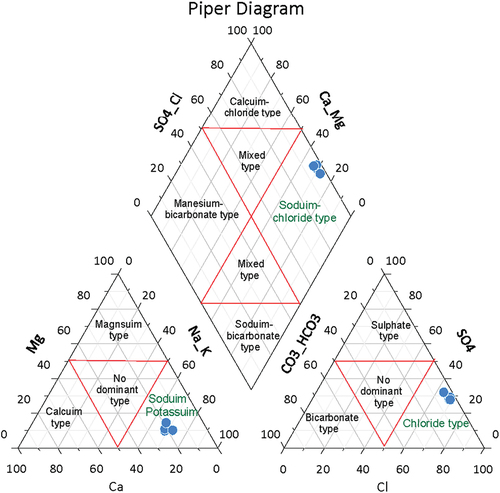
Figure 10. Concentrations of heavy metals.
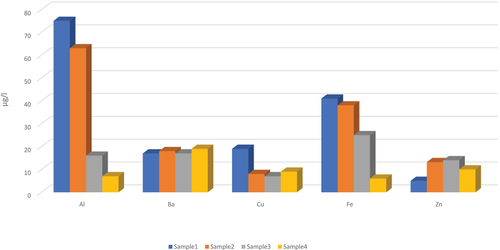
Figure 11. The sampled data on the conventional relationship of delta 18O and delta D with respect to the global meteoric water line.
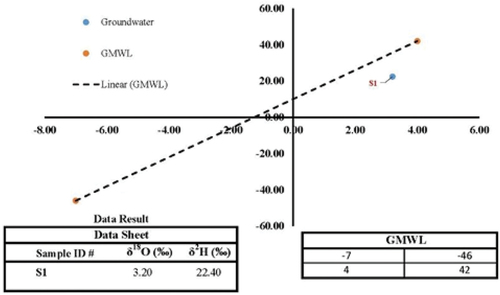
Figure 12. GPR profile location with length of 150 meters to north of formed lakes&output image after data processing.
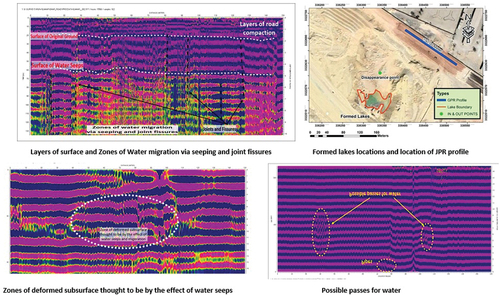
Figure 13. Networks construction ages in Mokattam city.