Figures & data
Figure 1. Palmitic acid reduces the autophagic flux in N43/5 cells. (A) Representatives images of N43/5 cells expressing the tandem fluorescent-tagged LC3 (mCherry-GFP-LC3), treated with BSA, PA (100 μM) or BafA1 (100 nM) for 6 h, or with Rapamycin (Rapa) 1 µM for 3 h. Scale bar: 10 μm. Nuclei were stained with DAPI (blue). (B) Quantification of LC3 dots per cell. Red bars represent the number of mCherry positive dots (autolysosomes; mCherry+/GFP-) and yellow bars the number of mCherry and GFP dots that colocalize (immature autophagosomes; mCherry+/GFP+). (C) Autophagic flux was determined by quantifying the ratio between red and yellow-positive puncta per cell. Data are presented as mean ± SEM, **p < .01,***p < .001, ****p < .0001. n = 3.
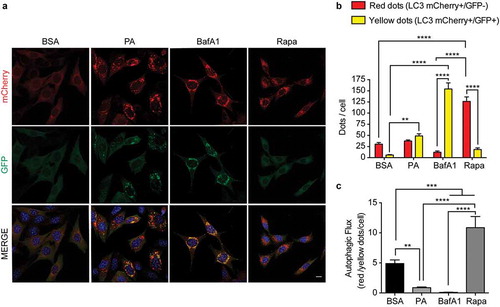
Figure 2. Palmitic acid induces lysosomal swelling and reduces autophagosome-lysosome fusion in N43/5 cells. (A) Representative images of N43/5 cells treated with BSA or PA (100 μM) for 6 h in presence or absence of BafA1 (100 nM) or its vehicle (DMSO) and stained against LAMP1 and LC3. LAMP1 (B) and LC3 (C) average dots size. (D) % of co-localization between LAMP1 and LC3 according to Manders’ Coefficient Analysis. Scale bar: 10 μm. Data are presented as mean ± SEM, *p < .05, **p < .01, ***p < .001. n = 3.
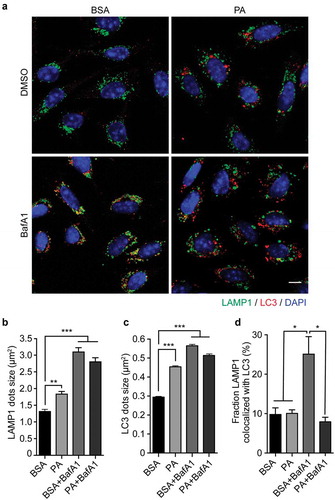
Figure 3. Palmitic acid does not reduce lysosomes acidity or lysosomal cathepsin B activity. (A) Representative confocal images of N43/5 cells treated with BSA, PA (100 μM), or BafA1 (100 nM) for 6 h and stained with LysoTracker. Nuclei were stained with DAPI (blue). Quantification of LysoTracker average fluorescence intensity in arbitrary units (a.u.), LysoTracker positive dots per cell and dots size are shown in (B), (C), (D), respectively. Scale bar: 10 μm. (E) Representative confocal images of N43/5 cells treated with BSA, PA (100 μM), or BafA1 (100 nM) for 6 h and stained with Magic Red, with its respective quantification of average fluorescence intensity in arbitrary units (a.u.) (F), number of positive dots per cell (G), and dots size (H). Nuclei were stained with Hoechst (blue). Scale bar: 10 μm. (I) Representative confocal images of the hypothalamic arcuate nucleus (ARC) from chow and HFD mice stained with Magic Red, with its respective quantification, in arbitrary units (a.u.) (J). Nuclei were stained with DAPI (blue). Scale bar: 10 μm. Data are presented as mean ± SEM, **p < .01, ***p < .001, ****p < .0001. n = 3.
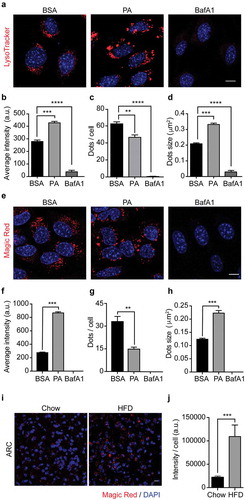
Figure 4. Palmitic acid induces the accumulation of large cellular degradative compartments (DGCs) in N43/5 cells. (A) Representative electronic microscopy images of N43/5 cells treated with BSA, PA (100 μM) or BafA1 for 6 h. Cellular degradative compartments (DGCs) are indicated by yellow arrowheads, yellow asterisks denote multilamellar bodies, red arrowheads show intraluminal vesicles, red asterisk indicates intraluminal vesicles surrounded by multiple membranes, yellow arrows denote multivesicular bodies. Inserts show a magnification of structures within the dashed square. DGCs number and size are shown in (B) and (C), respectively. Data are presented as mean ± SEM, *p < .05, ***p < .001, ****p < .0001. n = 3.
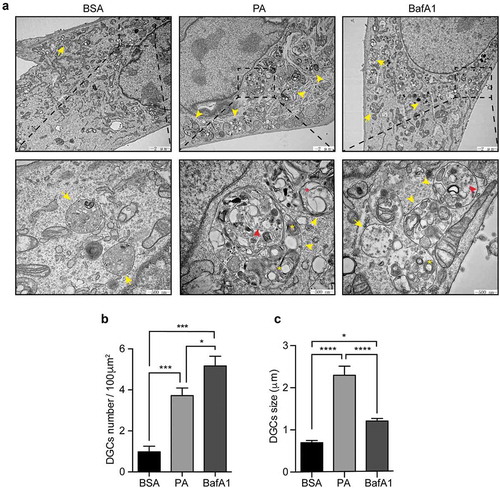
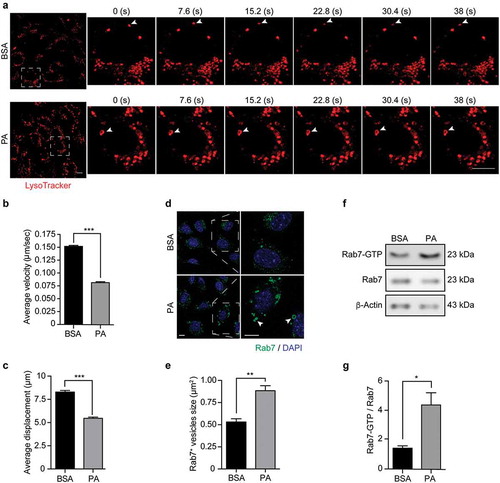
Figure 5. Palmitic acid reduces endolysosomal motility and increases Rab7 activation in N43/5 cells. (A) Representative images and zoomed-in time-lapse confocal sequence images of N43/5 cells treated with BSA or PA (100 μM) for 6 h and stained with LysoTracker. Zoom-ed in inserts represent one cell magnification within the dashed square, showing the dynamic movement of LysoTracker positive vesicles. Arrowhead indicates one LysoTracker positive vesicle movement over time. Scale bar: 10 μm. Average velocity (µm/s) and average total displacement (µm) of positive LysoTracker vesicles are shown in (B) and (C), respectively. Scale bar: 10 μm. (D) Representative confocal images of N43/5 cells treated with BSA or PA (100 μM) for 6 h and then stained against Rab7. Inserts show a magnification of structures within the dashed square. Arrowheads indicate enlarged Rab7 positive vesicles. Quantification of Rab7 positive structures size is shown in (E). Scale bar: 10 μm in the original image and in the zoomed-in images. (F) Representative blot showing Rab7 protein bound to GTP and Rab7 total protein levels with its respective quantification (G) in N43/5 cells following 6 h of the aforementioned treatments. *p < .05, **p < .01, ***p < .001. Data are presented as mean ± SEM. n = 3.