
Figures & data
Figure 1. Schematic diagram of the experimental plan. The osteosarcoma cell lines (U2- OS and Saos-2) were cultured at 37°C for 24 h and then exposed to vehicle/clemastine at 37°C for 72 h. Another set of cells were exposed to hyperthermia at 42°C for 2 h and returned to 37°C for a 6 h recovery phase. The expression of multiple signaling pathway markers was analyzed after treatment.
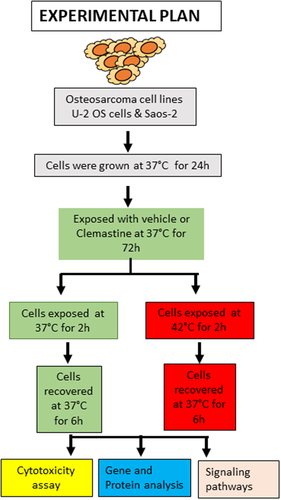
Figure 2. Hyperthermia inhibits clemastine-mediated OS cell survival. A & B) U-2 OS and Saos-2 cells were plated in 96 well plates at a density of 3000 cells/well for 24 h and treated with 0.5–40 µM clemastine for 72 h. The hyperthermic treatment was performed in a 42°C incubator for 2 h and returned to a 37°C incubator for 6 h recovery phase. A cell viability MTT assay was performed as described in the materials and methods section. The experiment was repeated thrice. *p < .05, **p < .01, ***p < .001 compared to the vehicle untreated cells. C) The cell colony formation assay. U-2 OS and Saos-2 cells (10,000 cells/well) were treated with clemastine or clemastine + hyperthermia as indicated, and a cell colony formation assay was performed. The blue colonies were photographed and counted manually, and the percentage of colony formation was plotted. **p < .01, ***p < .001 compared to the vehicle untreated cells. D) U-2 OS and Saos-2 cells (10,000 cells/well) were grown in ultra-low attachment surface 24 well plate (Corning) for 24 h and cells were treated with clemastine or clemastine + hyperthermia as indicated and cell spheroid formation was monitored, and images were captured under a light microscope using 4X objective (left panels). The spheroids area (n = 3) was calculated using ImageJ software (https://imagej.nih.gov/ij/) and plotted (right panels). ***p < .001, **p < .01 *p<.05 compared to control cells. E) U-2 OS and Saos-2 cells were treated with 6 µM and 8 µM clemastine for 72 h. The hyperthermic treatment was performed in a 42°C incubator for 2 h and returned to a 37°C incubator for 6 h recovery phases. A cell viability ATP assay was performed as described in the materials and methods section. The experiment was repeated thrice *p < .05, **p < .01, ***p < .001 compared to the untreated/vehicle cells. F) U-2 OS and Saos-2 cells were treated with 6µM clemastine for 72 h and the hyperthermic treatment was performed in a 42°C incubator for 2 h and returned to 37°C incubator for 6 h. The expressions of cleaved caspase-3, pro-caspase-3, cleaved-PARP, BAD, survivin, Bcl-xL, and β-tubulin were analyzed by immunoblotting.
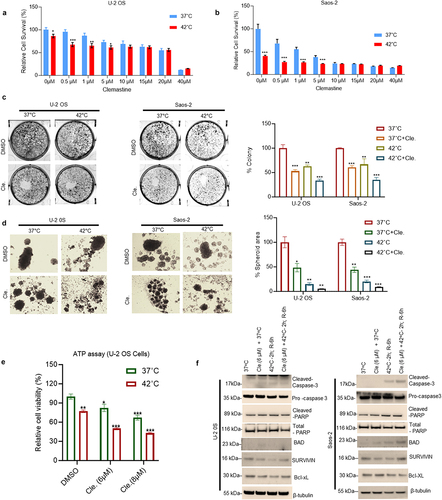
Figure 3. Clemastine and hyperthermia exposure regulates inflammatory and UPR signaling. A) U-2 OS and Saos-2 cells were treated with 6 µM clemastine for 72 h. The hyperthermic treatment was performed as described in the methods section. The relative mRNA expression of CAT, SOD1, CXCL8 (IL-8), TNFAIP8, IL-6, and TNFα were analyzed by RT/QPCR as described in the materials and methods section. *p<.05, **p<.01, ***p<.001 compared to vehicle treated OS cells. B) The effect of clemastine and clemastine + hyperthermia on SOD and CAT protein expression in OS cells was analyzed by immunoblotting (upper and lower panels). C) U-2 OS and Saos-2 cells were treated with 6 µM clemastine for 72 h. The hyperthermic treatment was performed as described in the methods section. The relative mRNA expression of indicated UPR genes was analyzed by RT/QPCR as described in the materials and methods section. *p<.05, **p<.01, ***p<.001 compared to vehicle treated OS cells. D) U-2 OS and Saos-2 cells were treated with 6 µM clemastine for 72 h. The clemastine and hyperthermic treatment was performed as indicated and as described in the methods section. Cells were then lysed and 60 µg of cell lysates were immunoblotted with ATF6, BIP, pERK, pEIF2α, IRE-1α, and GAPDH antibodies.
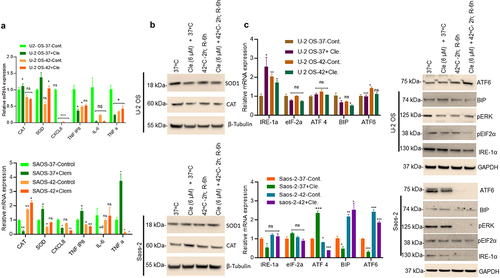
Figure 4. Combined clemastine and hyperthermia exposure inhibits AKT/mTOR and induces cellular autophagy in OS cells. A) U-2 OS and Saos-2 cells were treated with 6 µM clemastine for 72 h. The hyperthermic treatment was performed as described in the methods section. Cells were then lysed and 60 mg of cell lysates were immunoblotted with pS473-AKT, AKT, pS2448-mTOR, mTOR, and GAPDH antibodies (upper and lower panels). B) U-2 OS and Saos-2 cells were treated with 6 µM clemastine for 72 h alone or further exposed to the hyperthermic condition as described in the methods section. The relative mRNA expression of p62, ATG3, LC3B, BECLIN, and VPS-34 were analyzed by RT/qPCR as described in the materials and methods section. *p<.05, **p<.01, ***p<.001 compared to the vehicle treated cells. C) U-2 OS and Saos-2 cells were treated with 6 µM clemastine for 72 h. The hyperthermic treatment was performed as described in the methods section. Cells were then lysed and 60 µg of cell lysates were immunoblotted with autophagy biomarkers such as Sirt1, Beclin1, Rab 7, Lamp1, p62, LC3B I/II, and GAPDH. LC3B I/II and GAPDH band intensities were quantified by image J (https://imagej.nih.gov/ij/) and plotted. Similarly, the lysates were also immunoblotted with anti-ubiquitin mouse antibody (D).
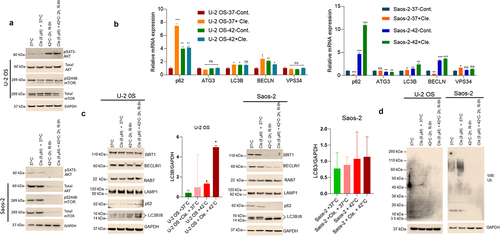
Figure 5. 3-MA inhibits LC3B-mediated puncta formation in OS cells after combined exposure to clemastine and hyperthermia. A & B) U-2 OS and Saos-2 cells (1x10^5) were transfected with 1 µg of EGFP-LC3B plasmid DNA and cells were treated with vehicle/6 µM clemastine for 72 h, then 2 h hyperthermic treatment and 6 h recovery phase. Cells were mounted on microscopic slides with a mounting medium containing nuclear DAPI stain. Imaging of the cells was carried out using a confocal fluorescence microscope. The number of GFP-LC3B-related puncta formed in the cells (n=4) was counted and plotted *p<.05, **p<.01, ***p<.001 compared to the vehicle-treated cells. C & D). U-2 OS and Saos-2 cells (1x10^5) were plated in 6 well plates for 24 h and transfected with 1 µg of EGFP-LC3B plasmid DNA. Cells were treated with vehicle/6 µM clemastine for 12 h then treated with 2 mM 3-MA for 60 h and exposed to 2 h hyperthermic treatment and 6 h recovery phase. Cells were mounted on microscopic slides with a mounting medium containing nuclear DAPI stain. Imaging of the cells was carried out using a confocal fluorescence microscope. The number of GFP-LC3B-related puncta formed in the cells (n=4) was counted and plotted.
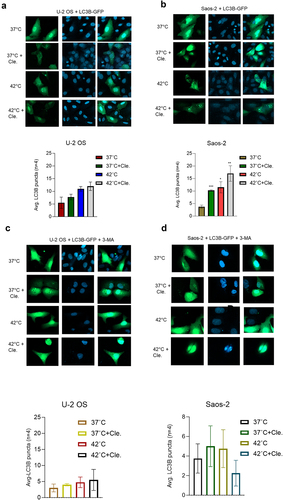
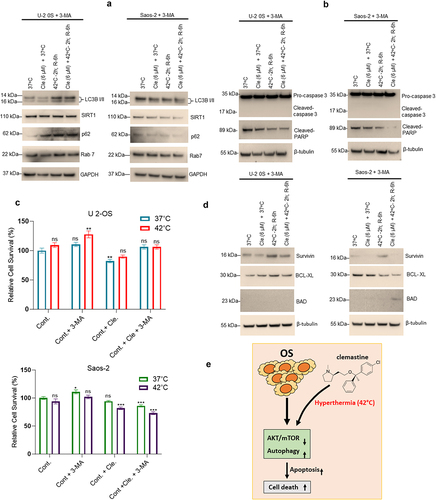
Figure 6. Inactivation of autophagy by 3-MA impairs sensitization of cell apoptosis after combined exposure to clemastine and hyperthermia in OS cells. A & B) U-2 OS and Saos-2 cells were treated with 6 µM clemastine and/or 2 mM 3-methyladenine for 72 h. The hyperthermic treatment was performed in a 42°C incubator for 2 h and then returned to 37°C for a 6 h recovery phase. Cells were then lysed and 60 µg of cell lysates were immunoblotted with Sirt1, p62, LC3B I/II, Rab7, pro-caspase 3, cleaved caspase 3, cleaved-PARP and GAPDH, and β-tubulin antibodies. C) U-2 OS and Saos-2 cells were treated with 6 µM clemastine and/or 3-methyladenine (2 mM) for 72 h. The hyperthermic treatment was performed in a 42°C incubator for 2 h and then returned to 37°C for 6 h recovery phase. Cell viability MTT assay was also performed as described in materials and methods. *p<.05, **p<.01, ***p<.001 compared to the untreated/vehicle treated cells. D) U-2 OS and Saos-2 cells were treated with 6 µM clemastine and/or 2 mM 3-methyladenine for 72 h. The hyperthermic treatment was performed in 42°C incubator for 2 h and then returned to 37°C for a 6 h recovery phase. Cells were then lysed, and 60 µg of cell lysates were immunoblotted with survivin, Bcl-xL, BAD, and β-tubulin antibodies. E) Schematic diagram represents the role of hyperthermia and clemastine in increasing autophagy-mediated cell death.
Supplemental Material
Download Zip (365.1 KB)Data availability statement
The published article includes all data sets generated/analyzed for this study. Data will be made available on request.