Figures & data
Figure 1. Selected landmark maps: (a) Flow maps: Minard (Library Lasage, Collection Ecole Nationale des Ponts et Chaussées); (b) Public transport navigation: Beck (from Garland, Citation1994); (c) dasymetric mapping (from Petrov, Citation2012); d) contiguous cartograms: German election (copyright: Staatsbibliothek zu Berlin – Preußischer Kulturbesitz; (e) mapping by everyone: (OpenStreetMap).
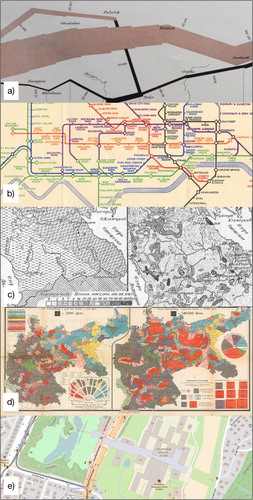
Figure 2. The basic keywords of cartography represented in a Wordle, based on over 150 definitions provided by cartographers attending the ICC 2013 in Dresden, Germany.
Figure 3. Results of the Map definition survey.
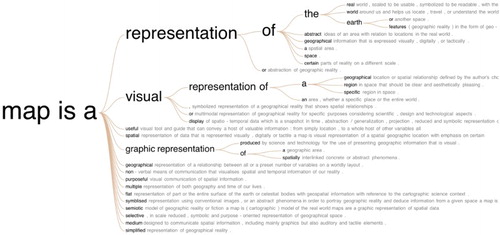
Figure 4. Wordle map definitions (http://www.maphist.nl/discpapers.html).
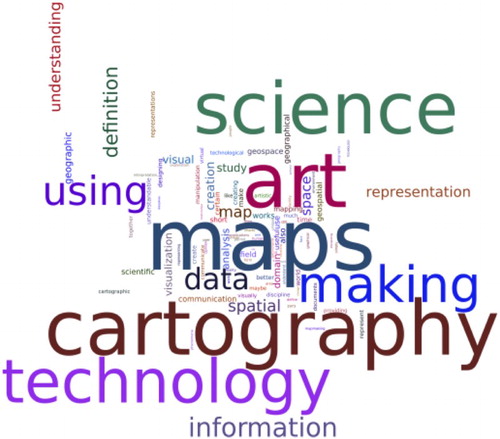
Figure 5. The definition cartography represented as a flow chart with the keywords art, science, and technology as the cartographer's tools and making and using as the process of engagement with a cartographic product.
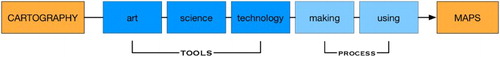
Figure 6. The external influences and elasticity of the cartographic definition. The red and blue flows each represent a certain moment in time when external and internal forces, represented by the red and blue keywords have been at work.
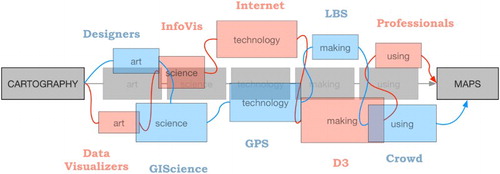
Figure 7. ICA’s Commissions and Working Groups over time.
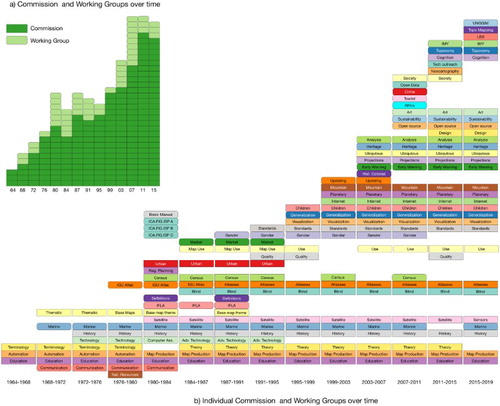
Figure 8. Commissions and Working Groups in 2015 and how they are associated with the definition of cartography.
Figure 9. Thematic Landscape of the International Cartographic Conferences 1993–2013. Thematic clusters emerging 4906 proceeding contributions for the past 11 ICA Conferences (Figure based on Deseoe, Citation2015).
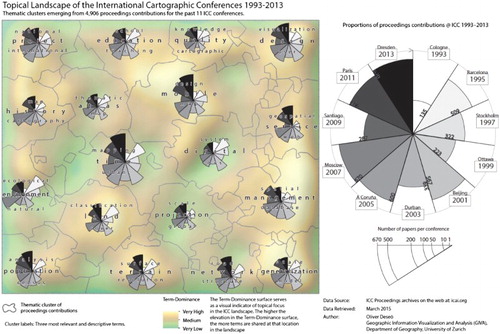
Figure 10. ICA publication landscape evolving over time (1993–2013) (Deseoe, Citation2015, p. 34). Author’s own.
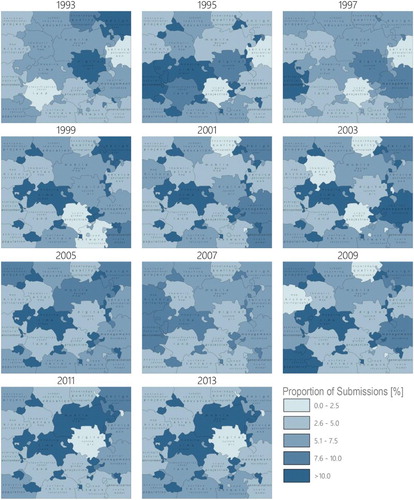
Figure 11. ICCs: (a) the location of the ICCs; (b) the relation between the Commissions and the spatializations of the conference content; (c) number of submission of the selected conferences. Author’s own.
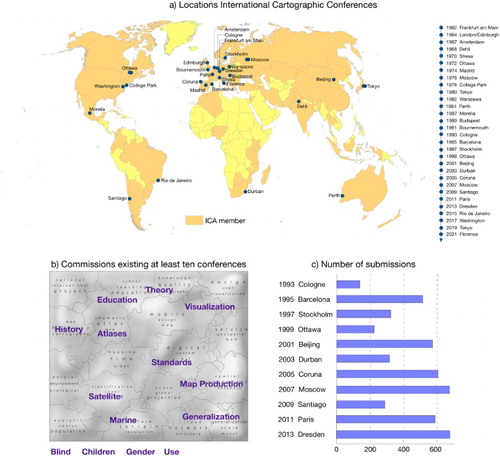
Figure 12. Geography and the Commissions and Working Groups: (a) Countries represented by Commission and Working Group chairs; (b) number of involved countries over time; (c) Number of chairs per country; (d) Geographic distribution of the chairs over time. Author’s own.
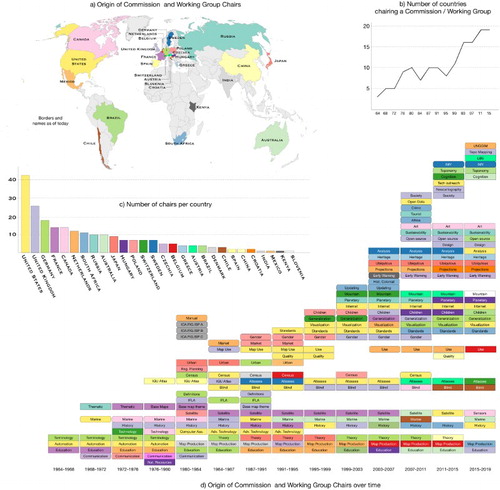
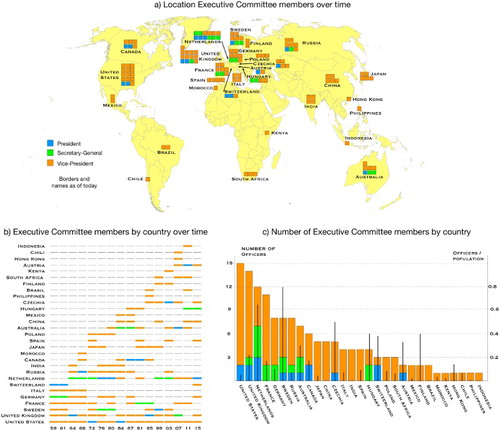
Figure 13. The Geography of the Executive Committee: (a) geographic origin of the Executive Committee members; (b) members by country over time; (c) total number of members per country, and the respective proportion of the country’s population. Author’s own.