Figures & data
Table 1. Mean overall distortion values  of some often used projections (pp: pointed-polar; fp: flat-polar; mixed: partly pointed-polar, partly flat-polar).
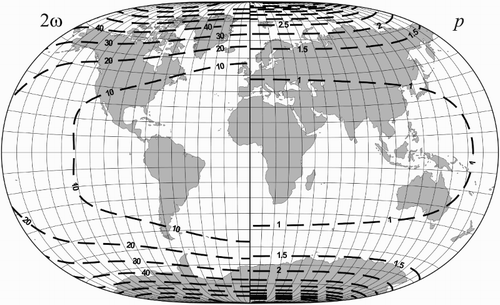
Figure 1. The isolines of the maximum angular deformation and the area scale p for the minimum distortion pseudocylindrical projection (a).
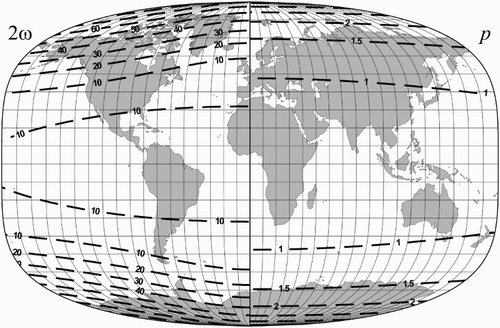
Figure 2. The isolines of the maximum angular deformation and the area scale p for the minimum distortion pseudocylindrical projection (b).
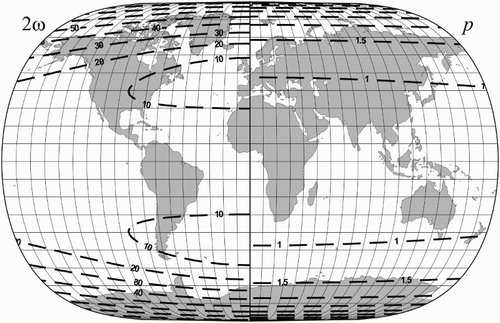
Table 2. Coefficients and mean overall distortion values of the studied projections.
Figure 3. The isolines of the maximum angular deformation and the area scale p for the minimum distortion non-conical projection (d).
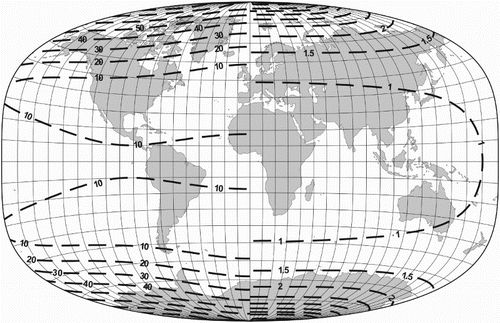
Figure 4. The isolines of the maximum angular deformation and the area scale p for the minimum distortion non-conical projection (e).
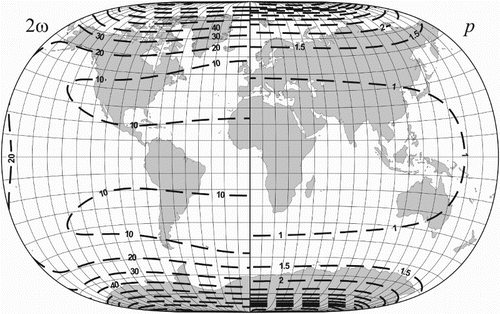
Figure 5. The isolines of the maximum angular deformation and the area scale p for the non-conical projection (f) derived from the projection (e) with reduced maximal outline curvature.