
Figures & data
Table 1. Correlation matrices for scale-dependent and scale-independent distortions.
Figure 1. Relations between various criteria.
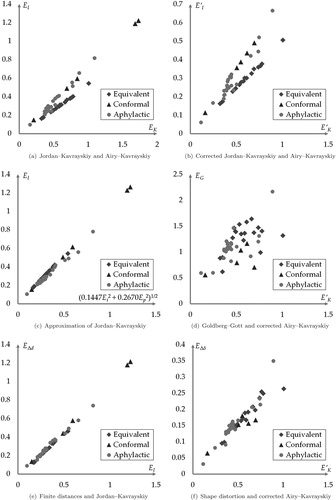
Figure 2. The best pseudoazimuthal projections for the Atlantic Ocean according to different criteria.
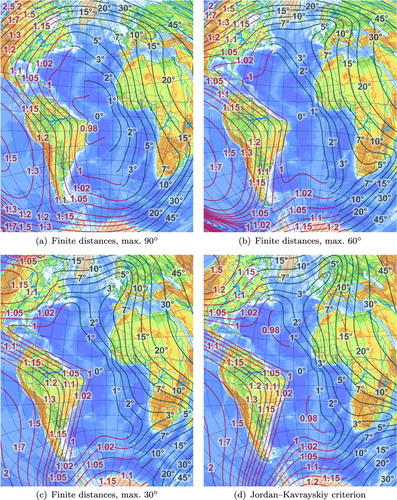
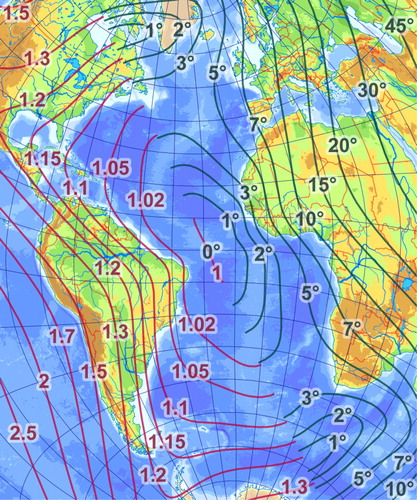
Figure 3. The best pseudoazimuthal projection for the Atlantic Ocean according to the average of flexion and skewness.
Table
Table