Figures & data
Figure 1. The same area shown on three different maps: (a) symbolic plan map (above angle), (b) a pictorial map (above angle) and (c) a pictorial map (oblique angle).
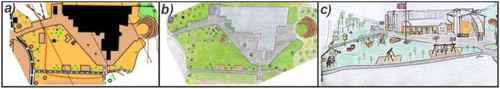
Figure 2. The pictorial map that was used by the children in present study, with seven plotted controls marked with pink circles and one starting point marked with a triangle.
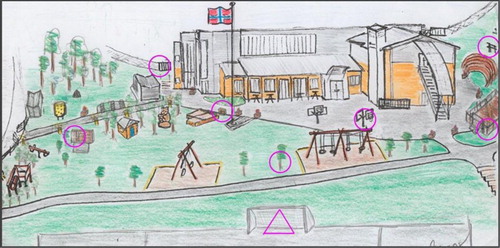
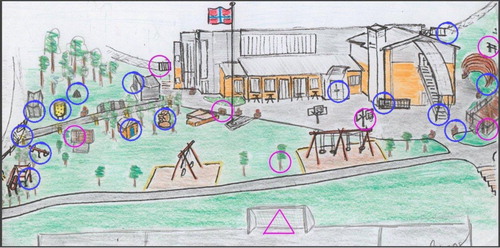
Figure 3. The pictorial map showing the start point marked with a triangle and the 22 controls that was marked with white and orange flags and units for registration in the area. The pink circles are the 7 controls that were marked on the children's maps and for them to find. The 15 blue circles were only marked in the terrain, but not on the children's map.