Figures & data
Figure 1. The apparent size of objects, expressed as angle δ, defines the size of their retinal image and depends on their real-world size (S₁, S₂) and distance from the observer (D₁, D₂).
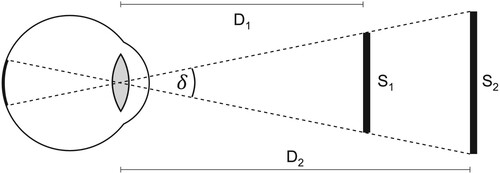
Table 1. Various real-world sizes at 30 and 60 cm viewing distances, and their corresponding angular sizes, logMAR and ppi values. Numbers set in bold indicate anchoring values of special relevance, as explained in the comments column and referred to from various parts of the paper.
Table 2. Minimum dimensions for cartographic point symbols, as specified by various authors. Only values for optimal contrast are listed. Values established in empirical studies are set in bold, values converted from other units for this paper are set in italics.
Table 3. Minimum dimensions for cartographic line symbols, as specified by various authors. Only values for optimal contrast are listed.
Figure 2. Graphical representation of current symbology guidelines for printed maps, extracted from Hake et al. (Citation2002) and Schweizerische Gesellschaft für Kartographie (Citation2002).
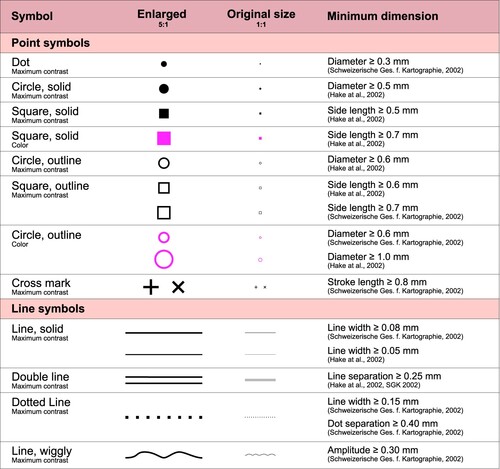
Figure 3. Applying minimum dimensions in the generalization of building footprints (Spiess, Citation1990).
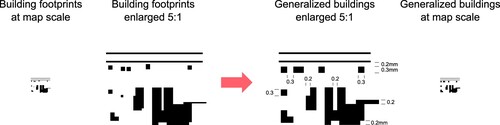
Table 4. Minimum dimensions for areas on maps, as specified by various authors. Only values for optimal contrast are listed.
Table 5. Minimum dimensions for text labels on maps, as specified by various authors.
Figure 4. Development of pixel densities of mobile phone screens over the last 20 years. Pixel density of commercially available devices has peaked at about 800 pixels per inch (PPI). Sources: pixensity.com, wikipedia.org.
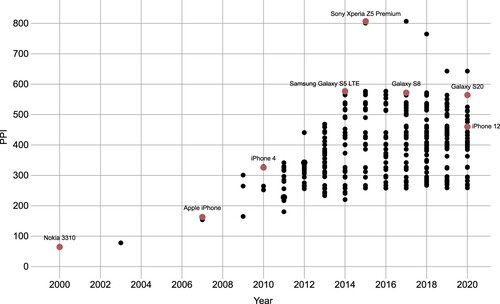
Table 6. Minimum dimensions for point symbols on screen, as specified by various authors. Values established in empirical studies are set in bold, values converted from other units for this paper are set in italics.
Table 7. Minimum dimensions for line symbols on screen, as specified by various authors. Values established in empirical studies are set in bold, values converted from other units for this paper are set in italics.
Table 8. Minimum dimensions for areas depicted on screen, as specified by various authors.
Table 9. Minimum dimensions for text labels on screen, as specified by various authors. Values established in empirical studies are set in bold, values converted from other units for this paper are set in italics.
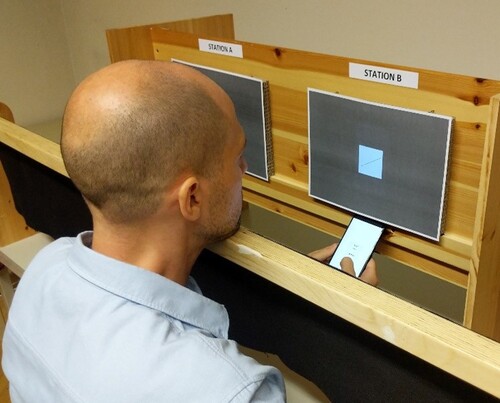
Figure 5. Empirical verification of the legibility of cartographic symbology on various digital displays in a lab-based setting (Ledermann, Citation2022).