Figures & data
Figure 1. Sample of cartographic (a, b, and c) and geovisual analytics (d, e, and f) approaches to mapping and making sense of movement data.
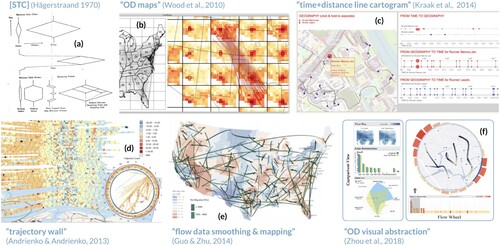
Figure 2. Compilation of graphics detailing the personal journey of a multi-day long distance cycling event. Adapted from ‘Visualizing personal progress in participatory sports cycling events’ by Wood (Citation2015).
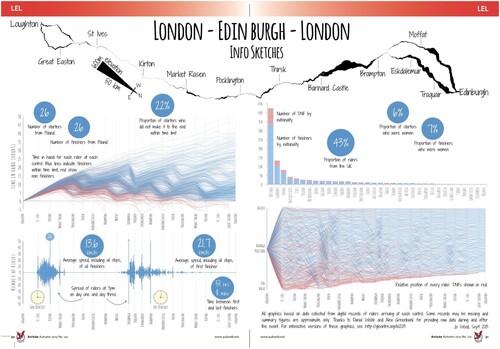
Figure 3. Visits, an interactive personal geovisualization that facilitates reminiscing and sharing travel memories. Adapted from ‘Visual mementos: Reflecting memories with personal data’ by Thudt et al. (Citation2015).
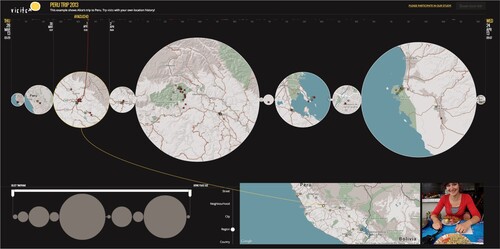
Figure 4. Shifted Maps, an integrated map and network geovisualization that enables exploration of spatial and temporal topologies in personal movement data. Adapted from ‘Shifted Maps: Revealing spatio-temporal topologies in movement data’ by Otten et al. (Citation2018).
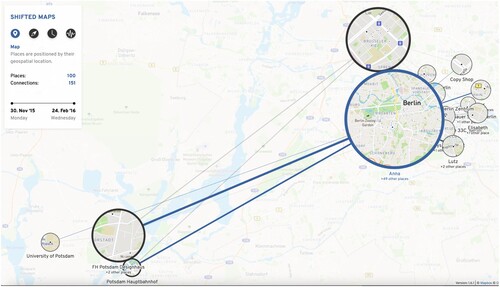
Figure 5. The Urban Emotions concept integrates and correlates arousal measurements, subjective observations, and crowdsourced data in urban environments to enrich the city planning process. Adapted from ‘Urban emotions—Geo-semantic emotion extraction from technical sensors, human sensors and crowdsourced data’ by Resch et al. (Citation2015).
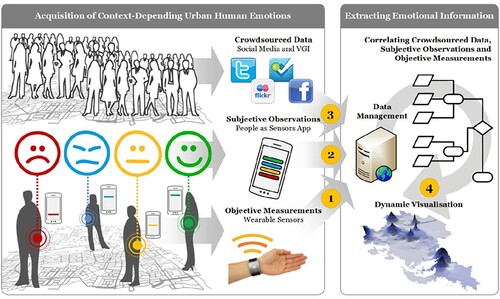
Figure 6. Mapped depictions of emotion data used to create quieter, happier, and more beautiful pedestrian routes (Quercia et al., Citation2014; a) and reveal spatiotemporal patterns in citizens’ perceptions of cities (Resch et al., Citation2016; b).
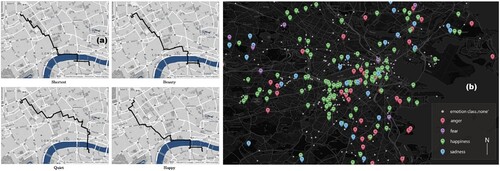
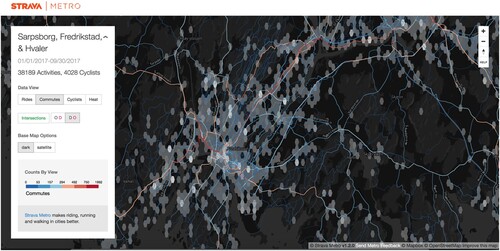
Figure 7. Metro DataView, an interactive flow map that depicts volumes of bicycling trips, commute-designated trips, and bicyclists across an urban network to inform data-driven city planning processes. Adapted from ‘User-centered Design and Evaluation of a Geovisualization Application Leveraging Aggregated Quantified-Self Data’ by Nelson & MacEachren, Citation2020.