
Figures & data
Figure 1. Tracing of the portolan chart of Angelino Dulceti (1339).
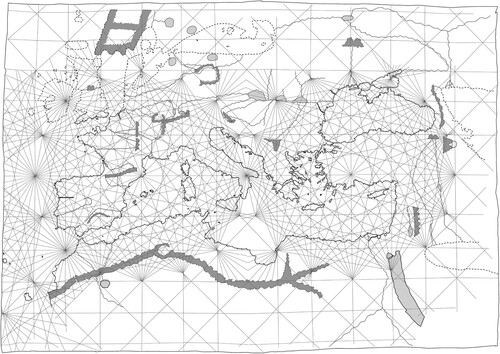
Table 1. Portolan charts analysed.
Figure 2. Boundary between the Atlantic South (inside the dashed ellipse) and the Atlantic Mid sub-charts on Dulceti’s chart, of which the coastline tracing is shown.
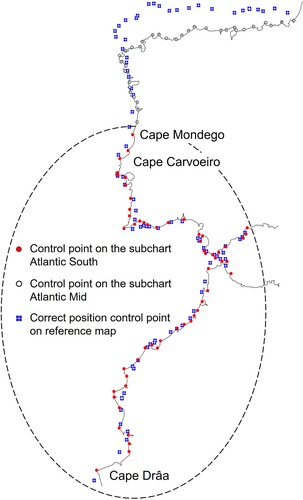
Figure 3. Anticlockwise tilt angle of sub-charts in degrees. The mean magnetic declination for the year 1250 of the sub-charts is shown as small red circles. A proper representation of the spatial variation of the magnetic declination is provided in .
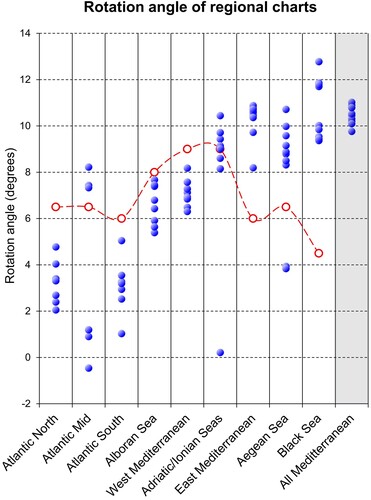
Figure 4. Scale differences of sub-charts, relative to the western Mediterranean on the same portolan chart.
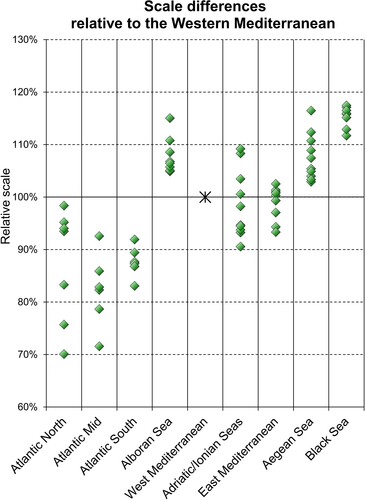
Figure 5. Stretch (or compression) of sub-charts in east–west direction.
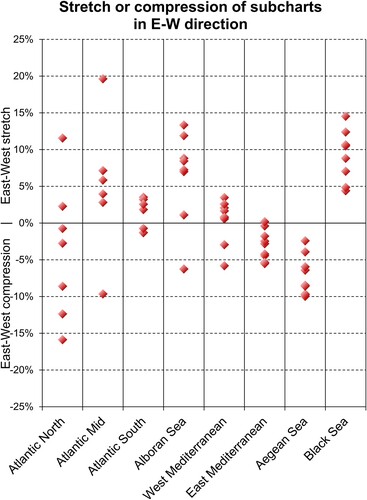
Figure 6. Degree-of-fit (planimetric accuracy) of sub-charts in kilometres. In the rightmost column (grey) the degree-of-fit is shown of the entire Mediterranean and Black Sea, excluding the Atlantic coasts.
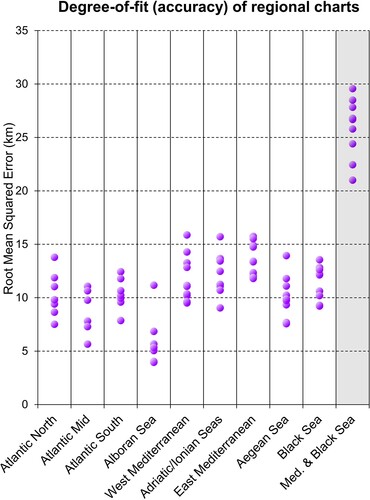
Figure 7. Length of the portolan mile in kilometres, derived from the scale bars on 10 charts and the numerical data in the Compasso de Navegare and Liber de existencia riveriarum. Scale bars on the same chart are grouped and shown in the same colour. The mile values were corrected for deformation of the parchment and apply to the mid-latitude (40°N) of the western Mediterranean.
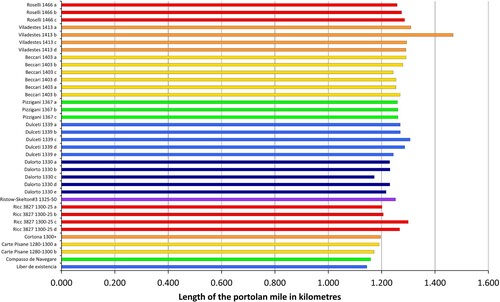
Figure 8. Coverage areas of sub-charts
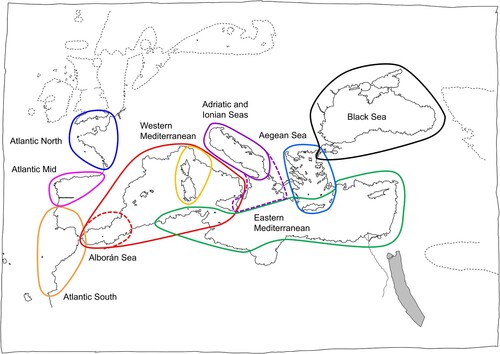
Figure 9. Composite of rectified sub-charts of Angelino Dulceti’s portolan chart. Its coastal outlines have been traced in blue for better visibility; the coastlines on the Mercator reference chart are shown in red.
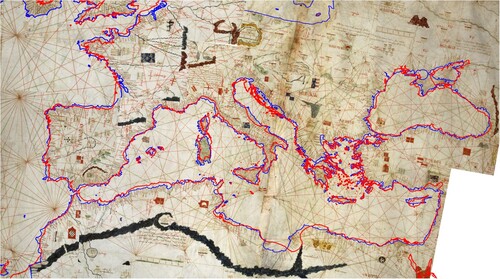
Figure 10. Lines of equal magnetic declination in the Mediterranean of 1250.
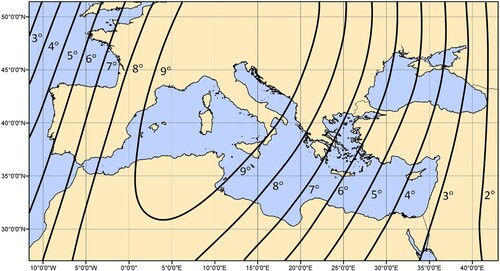
Figure 11. Plane-charted network of rhumb lines in the western Mediterranean, used for simulating ‘medieval’ charting.
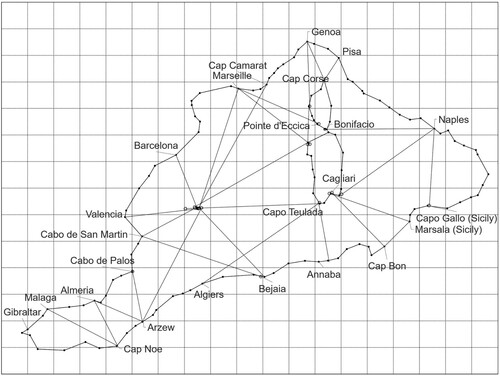
Figure 12. Bearing errors as a function of longitude in the Liber de existencia riveriarum in degrees. The horizontal red line indicates the mean error of 0.7°.
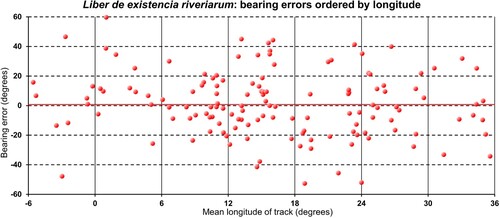
Figure 13. Bearing errors in the Liber de existencia against the background of bearing errors of tracks, scaled from the Carte Pisane.
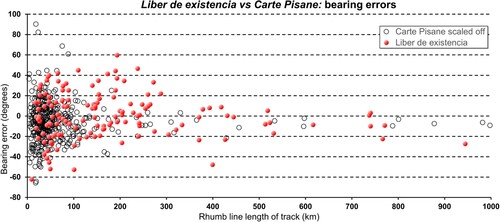
Table 2. Comparison of the accuracy (standard deviations) of the data in the Liber de existencia riveriarum and the Compasso de Navegare.