
Figures & data
Figure 1. Growth curves of Pseudomonas aeruginosa clinical CF isolates (n = 56, gray lines) and quality control isolates (black lines).
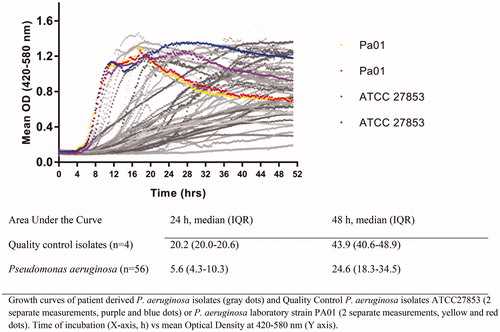
Table 1. Visual and VIZION™ antibiotic susceptibility MIC and SIR category results after 24 h of incubation (n = 56).
Table 2. Reliability and agreement between VIZION and visual readout of Sensititre EURGNCOL broth dilution of P. aeruginosa isolates from CF patients (n = 56).
Supplemental material