
Figures & data
Figure 1. Flowchart patient inclusion.
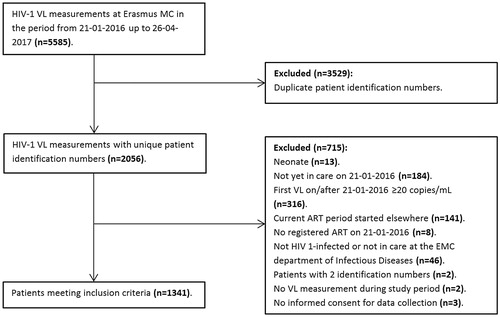
Table 1. Overview of baseline characteristics of patients included in the study.
Table 2. Univariate and multivariate logistic regression results: patient, laboratory, and therapy characteristics, stratified by VL, that is, negative (n = 958) or positive (n = 383) at T0.
Table 3. VL at T0 and T1 (all patients with 2 VL measurements).
Table 4. Univariate and multivariate logistic regression results: patient, laboratory, and therapy characteristics stratified by VL (i.e. <20 copies/mL or ≥20 copies/mL) at T1 (all patients).