
Figures & data
Figure 1. Flowchart of participants included by year and follow-up points.
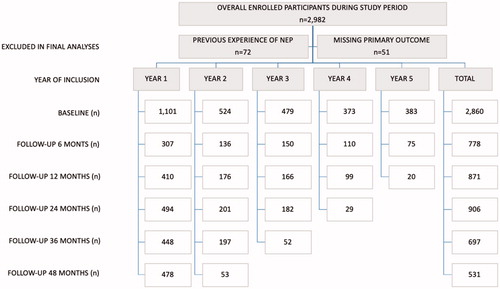
Table 1. Baseline characteristics at inclusion for the included study population and injection risk behaviours (2013–2018, N = 2860).
Table 2. Adjusted odds ratios (aORs) for sharing needle/syringe and paraphernalia during the past month at inclusion, (2013–2018, N = 2860).
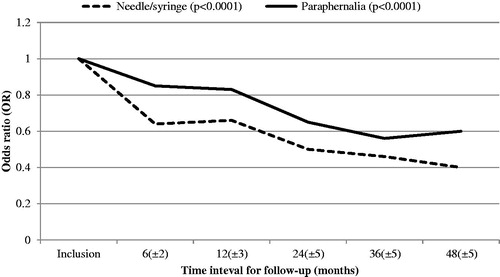
Figure 2. Changes in injection risk behaviours (sharing needle/syringe and paraphernalia) following inclusion in the NEP. Odds ratio (OR) at inclusion is set at 1 as reference value. N = 2860 at inclusion. p values represent changes in injection risk behaviours over the whole follow-up time.
Supplemental material