
Figures & data
Table 1. Total UTI antibiotic prescriptions to men ≥16 years in Norway 2008–2018.
Figure 1. Yearly prescriptions of the different UTI antibiotics per 1000 male inhabitants in Norway 2008–2018. Population statistics based on male inhabitants ≥16 years of age, collected by Statistics Norway (SSB).
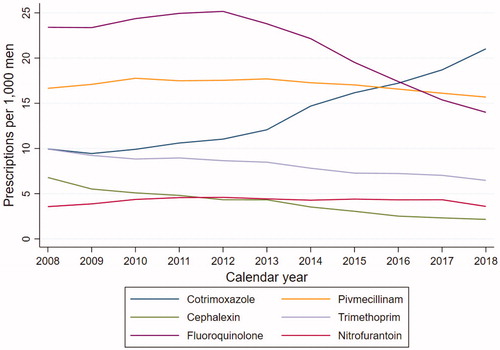
Figure 2. Proportion (%) of prescriptions of UTI antibiotic resulting in antibiotic switch by days after initial treatment.
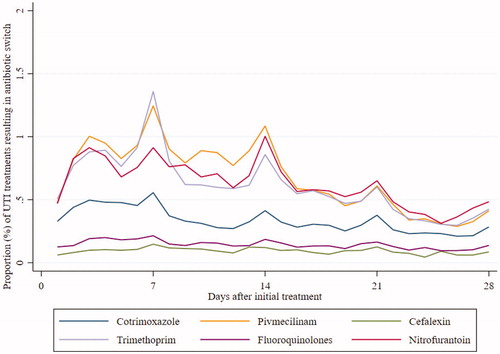
Table 2. Multivariate logistic analysis showing factors associated with antibiotic switch within 14 days after initial prescription.
Supplemental material