
Figures & data
Figure 1. Study design. Local influenza and COVID-19 patients were included from Haukeland University Hospital and Haraldsplass Deaconess Hospital during the 2018/2019 influenza season and spring/summer of 2020. The national cohort included COVID-19 patient data from the Norwegian Intensive Care and Pandemic Registry. Inclusion criteria were age > = 18 years, and a diagnosis of either influenza in 2018/2019 or COVID-19 in 2020/2021.
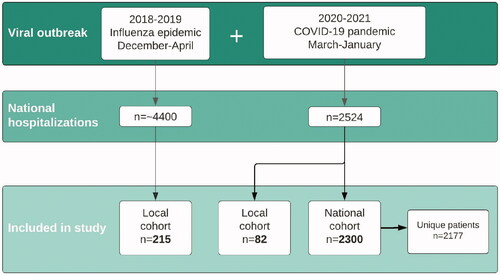
Table 1. Clinical characteristics and outcomes of COVID-19 and influenza patients.
Figure 2. Monthly COVID-19 hospital admissions and antibiotic prescriptions from February 2020 to January 2021. Upper part: National COVID-19 hospital admissions per month (green line). Admissions peaked during spring and autumn of 2020 corresponding to the first and second pandemic wave (divided by the vertical dotted line). Lower part: Proportion of admitted patients receiving antibiotics any time during admission (pink line) and within 24 h of admission (purple line).
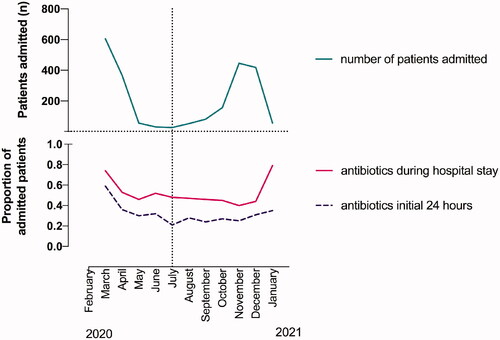
Figure 3. Adjusted odds ratios for antibiotic prescription. Adjusted odds ratios (aOR) for antibiotic prescription in (a) COVID-19 patients compared to influenza patients, (b) local COVID-19 patients compared to national COVID-19 patients in the first pandemic wave and (c) national COVID-19 patients in the second compared to first pandemic wave. Odds were adjusted for chest X-ray infiltrates, age and comorbidities.
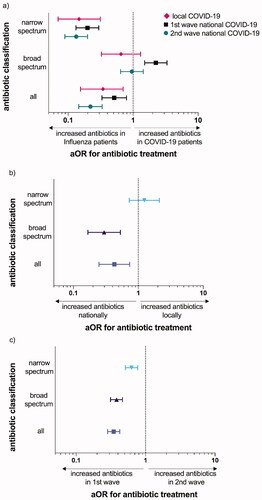
Table 2. Clinical characteristics of COVID-19 patients during the first and second pandemic wave.
Table 3. Factors associated with antibiotic prescription.