
Figures & data
Figure 1. Frequency distributions of the number of close contacts and secondary infections of the 415 index cases. (A) household close contacts; (B) secondary infections within households; (C) total close contacts; (D) total secondary infections. Index cases with zero close contacts were included in the estimation of reproduction numbers.
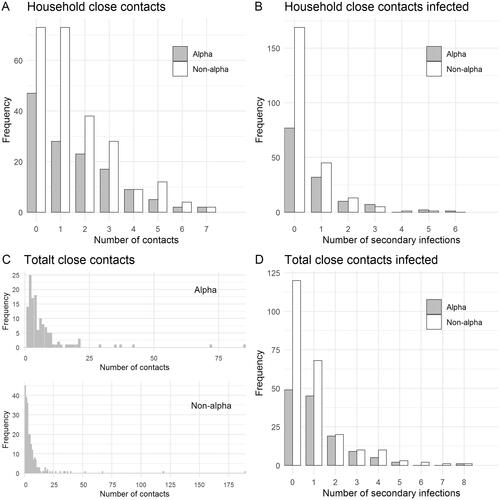
Table 1. The number of primary cases and their average number of close contacts and secondary infections by age and lineage.
Table 2. The estimated secondary attack rates (SAR) for the alpha lineage and for other lineages, with the relative risk between them, and univariate analyses of the impact of age of primary case and household size on SAR within households for the alpha lineageand other lineages.
Table 3. Estimated reproduction numbers for the alpha lineage and for other lineages, as well as the relative ratio between them.