
Figures & data
Figure 1. (A) Number of COVID-19 hospital admissions per month/100,000 inhabitants in Sweden; (B) Crude 60-day all-cause mortality in hospitalized COVID-19 patients related to month of hospital admission; (C) Relative risks with 95% confidence intervals (CI) of death from any cause within 60 days after hospital admission related to month of hospital admission. The model included adjustment for sex, age (continuous, linear and quadratic terms, not shown in the plot), Charlson Comorbidity Index score, care dependency, country of birth, education, disposable income quintile, source of income and health care region. (D) Scatter plot of number of COVID-19 hospital admissions/100,000 inhabitants in Sweden (X-axis) and crude 60-day all-cause mortality in hospitalized COVID-19 patients related to month of hospital admission (Y-axis). Regression line parameters and coefficient of correlation calculated excluding March. (E) Scatter plot of number of COVID-19 hospital admissions/100,000 inhabitants in Sweden (X-axis) and logarithm of relative risk estimates of death from any cause within 60 days after hospital admission related to month of hospital admission (Y-axis). Coefficient of correlation calculated excluding March.
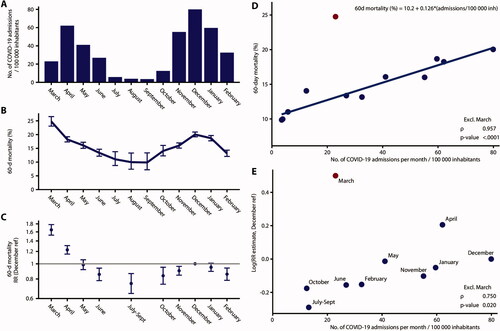
Table 1. Baseline patient characteristics: as total and stratified by month of admission.
Table 2. Characteristics of the patient population treated on intensive care units (ICU), by month of hospital admission and survival outcome at 60 days follow-up.
Supplemental Material
Download EPS Image (570.2 KB)Supplemental Material
Download EPS Image (516.4 KB)Data availability statement
The data underlying this article cannot be shared publicly due to regulations under Swedish law. According to the Swedish Ethics Review Act, the General Data Protection Regulation, and the Public Access to Information and Secrecy Act, patient data can only be made available, after legal review, to researchers who meet the criteria for access to this type of confidential data. Requests regarding data in this report may be made to the senior author.